Comparing two groups, and how far to predict
What this lesson covers
- To compare data on the same variable from two groups in the same population, the 75%-to-50% comparison rule for informal inferences is used. If the groups are called A and B, and If more than 50% of group B’s data is larger than 75% of group A’s data, then we can make the claim that B tends to be larger than A back in the population.
- An interpolation involves making predictions within the range of a numerical data variable.
- An extrapolation involves making predictions outside the range of a numerical data variable.
Two averages are not a comparison
- Group A averages six. Group C averages seven.
- So C is bigger. That is the obvious conclusion.
- And it is not one the data supports. Here is why.
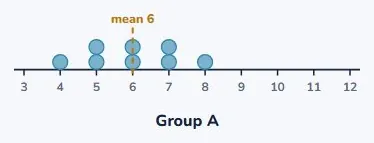
Group A
- Eight values: four, five, five, six, six, seven, seven, eight.
- The mean is six, and the values spread from four to eight.
- Remember that spread. It is about to matter.
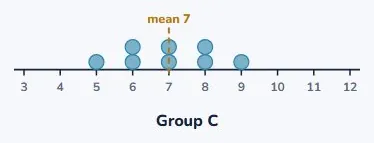
Group C, with the higher mean
- Five, six, six, seven, seven, eight, eight, nine.
- Mean of seven, a whole point higher than A.
- But look where the dots are. They are almost on top of each other.
What the mean threw away
- Pick one person from each group at random.
- Plenty of the time the A person will be the larger one.
- A mean is one number for a whole distribution. The spread is gone.
| Group | Mean | Note |
|---|---|---|
| Group A mean | 6 | |
| Group C mean | 7 | higher |
| But they overlap | almost completely | |
| One number | threw away the spread |
So there is a rule for this
- Find the value that three quarters of group A sits below.
- Then ask how much of group B is above that value.
- More than half of B, and you may make a claim. Otherwise not.
| Step | What to do |
|---|---|
| Take group A | find where 75% of it sits below |
| Now look at group B | how much is above that point? |
| More than half of B | you may claim B tends to be larger |
| Half or less | you may not claim anything |
Now a group that is genuinely higher
- Group B: six, seven, eight, eight, nine, nine, ten, eleven.
- Three quarters of group A sits below seven.
- How many of B are above seven? Six of the eight.
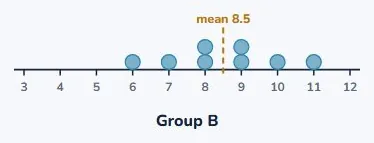
Six out of eight is seventy-five percent
- That is comfortably more than half of group B.
- So the rule says you may make the claim.
- B tends to be larger than A, back in the population.
| Check | Working | Result |
|---|---|---|
| A: 4 5 5 6 6 7 7 8 | 75% sits at 7 | |
| B: 6 7 8 8 9 9 10 11 | above 7 | six of eight |
| Six of eight | is 75% | over half |
| So | B tends to be larger | claim allowed |
And back to group C
- How many of C are above seven? Only three of the eight.
- That is thirty-seven percent. Less than half.
- So no claim, even though C had the higher mean.
| Check | Working | Result |
|---|---|---|
| C: 5 6 6 7 7 8 8 9 | above 7 | three of eight |
| Three of eight | is 37.5% | under half |
| Even though | C’s mean is higher | |
| No claim | can be made |
The rule does not give you an answer
- It gives you permission, or it withholds it.
- When it withholds it, the honest finding is that you cannot tell.
- "Cannot tell from this sample" is a real result, not a failure.
The exact words matter
- "Tends to be larger", not "is larger". That allows for the overlap.
- "Back in the population", not just in these sixteen people.
- Both halves are hedges and both of them are the point.
| Say | Not |
|---|---|
| "B tends to be larger" | not "B is larger" |
| "back in the population" | not just in this sample |
| Both halves matter | and both are hedges |
| Overstating | is the commonest error here |
What you are actually doing
- You measured a sample. You want to talk about everyone.
- That step across is the inference, and it is the whole risk.
- The rule is what decides whether you are allowed to take it.
| Stage | What it is | |
|---|---|---|
| You measured | a sample | |
| You want to talk about | the population | |
| That step | is the inference | |
| The rule | decides if it is allowed |
Predicting inside your data
- Your scatter plot covers one hour to six hours of study.
- Predicting at three and a half is inside that range.
- You have real points either side of it. That is interpolation.
| Situation | Where | Name |
|---|---|---|
| Data from 1 to 6 hours | ||
| Predicting at 3.5 | inside the range | interpolation |
| You have evidence | either side of it | |
| Reasonably safe |
And predicting outside it
- Plot height against age for five to fifteen year olds.
- Beautiful straight line. Now use it to predict at age forty.
- It says three metres. The pattern stopped and the line did not.
| Step | Detail | Result |
|---|---|---|
| Height against age | ages 5 to 15 | a strong line |
| Predict at age 40 | outside the data | extrapolation |
| The line says | about 3 metres | |
| The pattern stopped | and the line did not |
Writing the finding down
- Say what you compared, and on what measurement.
- Say what you found, in the hedged wording.
- And say what you cannot conclude. That sentence earns trust.
What to take away
- Seven lines, and the fifth one is where the marks are.
| Comparing means | is not comparing groups |
| The overlap | is where the answer is |
| Find where 75% of A sits | then look at B |
| More than half of B above it | a claim is allowed |
| The claim is hedged | "tends to be", in the population |
| Inside the data | interpolation, reasonably safe |
| Outside it | extrapolation, and be careful |
Your turn: four questions
- Pause here and answer all four in sentences.
- Question 2 is a percentage, worked out before you decide.
- Question 4 wants a reason, not just a yes or no.
| Question | |
|---|---|
| 1 | State the 75 to 50 rule in your own words. |
| 2 | A’s upper quartile is 12. 9 of B’s 20 beat it. |
| 3 | Interpolation or extrapolation: what differs? |
| 4 | Heights, ages 5 to 15. Predict at age 40? |
Show answer
1. Find the value that 75% of group A sits below. Then count how much of group B is above that value. If it is more than half of B, you may claim that B tends to be larger back in the population. 2. No. Nine out of twenty is 45%, which is not more than half, so the rule does not license the claim. The honest answer is that this sample cannot tell you. 3. Interpolation predicts inside the range of the data you collected, where you have evidence on both sides. Extrapolation predicts outside it, where you are assuming the pattern continues with nothing to support it. 4. No. The line fitted between five and fifteen would put a forty year old at around three metres tall. The relationship is real inside the data and stops existing outside it.
The answers
- Find where 75% of A sits below, then count how much of B is above it.
- Nine of twenty is forty-five percent, so no claim.
- Inside your data, or outside it.
- No: the line would make a forty year old three metres tall.
Is your child on track?
Take the free placement test