Choosing a graph, scaling it, and lines of best fit
What this lesson covers
- A distribution is formed from all the possible values of a variable and their frequencies. It can be shown using data visualisations that show patterns, trends, and variations and that include dot plots, bar graphs, frequency tables, box plots, histograms, time-series graphs, scatter plots, and two-way tables.
- A good data visualisation should allow viewers to discern the variable(s) and who the data was collected from, and then, depending on the type of visualisation, additional information such as frequency, proportions, patterns or trends, and units for numerical variables.
- In relationship investigations: sometimes one variable is thought of as predictive of the other variable; then the response or dependent variable is on the y-axis, and the ‘predictive’, explanatory, or independent variable is on the x-axis an eyeballed line or curve of best fit can be added for paired numerical data.
A graph is an argument
- A list of numbers tells you almost nothing at a glance.
- A graph of the same numbers can be read in a second.
- Which means choosing the graph is part of the argument.
What a distribution is
- Every value that occurs, and how often each one occurs.
- That is all the word means.
- A graph of it shows shape, spread and gaps at once.
| Term | Meaning |
|---|---|
| A distribution | every value that occurs |
| And | how often each one does |
| A graph of it | shows shape, spread and gaps |
| Which a list of numbers | does not |
The graphs available to you
- Bar graphs and two-way tables handle categories.
- Dot plots, histograms and box plots handle one numerical variable.
- Time series handle change, and scatter plots handle pairs.
| For | Use | Or |
|---|---|---|
| Categories | bar graph | two-way table |
| One numerical variable | dot plot | histogram, box plot |
| Over time | time-series graph | |
| Two variables together | scatter plot |
Two questions pick the graph
- What kind of variable is it: a category or a number?
- What am I trying to show: a shape, a trend, or a link?
- Those two answers choose for you. Not "which can I draw".
| Ask | Then |
|---|---|
| What kind of variable? | category or number |
| What am I showing? | a shape, a trend, a link |
| Those two answers | pick the graph for you |
| Not "which can I draw" |
Categories go in bars
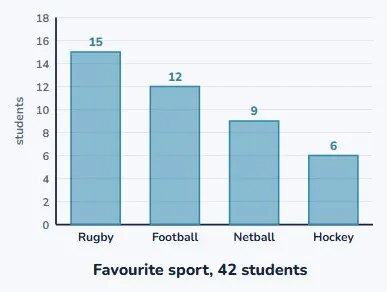
- Favourite sport is a category, so the bars are the sports.
- The height of each bar is how many people chose it.
- The order of the bars carries no meaning. You can rearrange them.
One numerical variable goes in a dot plot
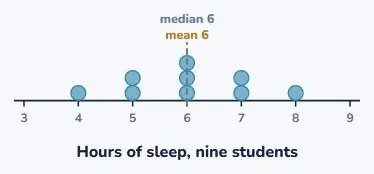
- Each dot is one measurement, stacked where it falls.
- Now the shape is visible: where it clusters, where it thins out.
- And the summaries can be drawn straight onto it.
What a reader has to be able to work out
- What was measured, and in what units.
- Who it was measured on. Which students, which year, where.
- Without those, a graph is a shape rather than evidence.
| Must show | Where | Note |
|---|---|---|
| What is measured | axis labels | |
| Who it is about | a title or caption | |
| The units | on the numerical axis | |
| Without those | it is a shape | not evidence |
The same two numbers, drawn twice
- Ninety-six and ninety-eight. About two percent apart.
- On an axis from zero, the bars look almost identical. True.
- On an axis from ninety, one looks a third taller. Also true.
| Drawn | Looks like | Honest? |
|---|---|---|
| Two values, 96 and 98 | about 2% apart | |
| Axis from 0 | the bars look alike | true |
| Axis from 90 | one looks a third taller | also true |
| Nothing is false | and the reader is fooled |
So where should an axis start?
- For bar charts, at zero, because the length is the comparison.
- Line graphs and scatter plots may start elsewhere.
- But label it clearly, so nobody is misled by accident.
| Chart | Rule |
|---|---|
| Bar charts | start the axis at zero |
| Because a bar’s length | is the comparison |
| Line and scatter plots | may start elsewhere |
| But say so clearly | on the axis |
Nothing on that chart was false
- Every number was right. The bars were drawn correctly.
- And every reader took away the wrong impression.
- That is how most misleading graphs work. Not by lying.
Two variables, and which goes where
- The one you think does the affecting goes across the bottom.
- The one that responds goes up the side.
- Hours studied across, test score up. It is a convention worth keeping.
| Variable | Called | Goes |
|---|---|---|
| Explanatory variable | the one you think causes | x-axis |
| Response variable | the one that answers | y-axis |
| Hours studied | explanatory | across |
| Test score | response | up |
A scatter plot
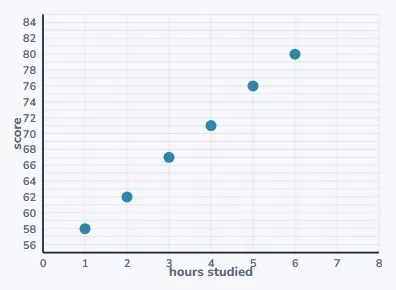
- Each point is one person, measured on both variables.
- Six students, their study hours and their scores.
- The points do not lie on a line, and they do have a direction.
Fitting a line by eye
- Draw a straight line through the middle of the cloud.
- Roughly as many points above it as below.
- Not joining the dots, and not bending to reach any of them.
| Do | Detail |
|---|---|
| Draw through the middle | of the cloud of points |
| Roughly as many above | as below |
| Not joining the dots | and not through every point |
| Then read predictions | off the line |
Predicting from it, and the limit
- Seven hours: go up to the line, then across. About 85.
- Inside the range of your data that is reasonably safe.
- A long way outside it, the line is a guess wearing a ruler.
| Reading | Confidence | Note |
|---|---|---|
| At 7 hours | read up to the line | about 85 |
| Inside the data | reasonably safe | |
| Far outside it | the line may not hold | |
| A line is a summary | not a law |
What to take away
- Seven lines, and the sixth one is the one to remember.
| A distribution | the values and how often each occurs |
| Categories | bar graph |
| One numerical variable | dot plot or histogram |
| Two variables | scatter plot |
| A reader needs | what, who, and the units |
| A truncated axis | misleads without lying |
| A line of best fit | goes through the middle, not the dots |
Your turn: four questions
- Pause here and answer all four.
- Question 2 is asking which variable explains which.
- Question 4 wants a number and a note about how sure you are.
| Question | |
|---|---|
| 1 | Favourite sport of 200 students. Which graph? |
| 2 | Sleep against test score. What goes on x? |
| 3 | Why can an axis starting at 90 mislead? |
| 4 | Predict the score at 7 hours of study. |
Show answer
1. A bar graph. Favourite sport is a categorical variable, so the bars are the categories and their heights are the counts. A two-way table would work if you also recorded something else, such as year level. 2. Hours of sleep. It is the explanatory variable, the one you think affects the other, so it goes across the bottom, and the score goes up the side as the response. 3. Because the length of a bar is what the reader compares, and cutting the bottom off the axis makes a small difference look like a large one. Nothing on the chart is false, which is what makes it effective. 4. About 85. Read up from 7 on the horizontal axis to the line of best fit and across. It is a little outside the data, so it is a reasonable estimate rather than a certainty.
The answers
- A bar graph, because favourite sport is a category.
- Hours of sleep, because it is the explanatory variable.
- It makes a small difference look large, without saying anything false.
- About 85, and it is just outside the data, so it is an estimate.
Is your child on track?
Take the free placement test