Samples, bias, and choosing the right average
What this lesson covers
- It is not always possible to get data from the entire population (as in a census). To make inferences about a population without a census, sampling is used.
- Samples must be taken randomly from the population, otherwise there will be bias in the data, leading to inaccurate and misleading statistics. Samples are ideally chosen using simple random sampling, in which each item of the population has an equal probability of being chosen.
- When sampling from a population, the distribution for a variable varies from sample to sample. To make a reliable inference about what is happening in the population, sample sizes need to be: about 1,000 for categorical variables (with the sample obtained using technology) at least 30 for numerical variables.
Every statistic is about people nobody asked
- A headline says forty percent of New Zealanders think something.
- Nobody asked five million people. They asked about a thousand.
- This lesson is about when that is allowed.
Why not just ask everyone?
- Asking everyone is a census, and New Zealand runs one.
- It costs millions and takes months, for one set of questions.
- So for anything else, you ask some and infer the rest.
| Approach | Detail | Cost |
|---|---|---|
| A census asks everyone | New Zealand does one | every five years |
| It costs | many millions | and takes months |
| For one question | that is not possible | |
| So you ask some | and infer the rest |
The thing that ruins a sample
- A biased sample is one that does not look like the population.
- Ask people leaving a gym how often they exercise.
- You will get an answer, and it will be confidently wrong.
| Problem | Example |
|---|---|
| A biased sample | does not look like the population |
| Asking at a gym | about exercise habits |
| Asking online | about internet access |
| The answer is wrong | and looks perfectly convincing |
It is usually not obvious
- An online poll about internet access misses everyone without it.
- A phone survey at 10am misses everyone at work.
- The question is always: who could not have been chosen?
What random actually means
- Every single member of the population is equally likely.
- The test: could any one of them have ended up in your sample?
- Whoever happened to be nearby fails that test immediately.
| Rule | In practice | Note |
|---|---|---|
| Simple random sampling | everyone equally likely | |
| The test | could any person | have been chosen? |
| Whoever is nearby | fails that test | |
| Use a random generator | not your judgement |
Doing it properly
- Number the population, then use a random number generator.
- Not your own choosing. People are terrible at being random.
- The technology is free and it is the whole of the method.
How many do you need?
- For a categorical variable, around a thousand.
- For a numerical one, at least thirty.
- A category carries less information per person, so you need more.
| Variable | Sample size |
|---|---|
| Categorical variable | about 1 000 |
| Numerical variable | at least 30 |
| Why the difference | a category carries less information |
| Biased and big | is still biased |
Big does not fix biased
- A biased sample of ten thousand is not better than one of thirty.
- It is worse, because it looks more convincing.
- Size reduces variation. It does nothing at all to bias.
Two fair samples will still disagree
- Take a proper random sample. Then take another one.
- They will not give identical answers, and neither is wrong.
- That spread is sampling variation, and bigger samples vary less.
| Step | Result | Name |
|---|---|---|
| Take a sample | get a result | |
| Take another | slightly different | |
| That spread | is sampling variation | not error |
| Bigger samples | vary less |
Collecting more than one thing
- Record height, and you can describe how tall people are.
- Record height and arm span for each person, and you can ask more.
- They have to be recorded together, or the link is gone.
| What you collect | What you can ask | Note |
|---|---|---|
| One variable | how tall are they | |
| Two at once | height and arm span | per person |
| Now you can ask | are they related? | |
| Record them together | or the link is lost |
Write the question before you collect anything
- Who exactly is the population? All Year 10s, or this school?
- What are you measuring, and in what units?
- Data collected without a question answers nothing in particular.
| Do this | Not that |
|---|---|
| Write the question first | then design the collection |
| Who is the population? | all Year 10s? this school? |
| What will you measure? | and in what units? |
| Data collected first | answers nothing in particular |
Two averages, one set of numbers
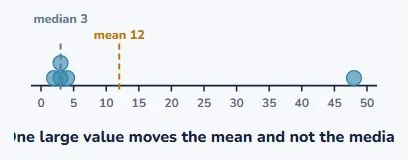
- Two, three, three, four, and forty-eight.
- The mean is twelve. The median is three.
- Four of the five values are below the mean.
So which one should you report?
- If the data has a long tail one way, use the median.
- If it is roughly symmetric, the mean is fine and says more.
- Ask what the average is meant to represent.
| Shape of the data | Use |
|---|---|
| A long tail one way | use the median |
| Roughly symmetric | the mean is fine |
| House prices, incomes | always reported as medians |
| Because a few very large ones | drag the mean up |
Which is why you never see a mean house price
- House prices and incomes both have a long tail upwards.
- A few very large ones would drag the mean well above typical.
- So they are reported as medians. Check tonight. They always are.
What to take away
- Seven lines, and the third one is the one people forget.
| A sample is a claim | about people you did not ask |
| Random means | everyone equally likely |
| A biased sample | is wrong at any size |
| Categorical | about 1 000 |
| Numerical | at least 30 |
| Samples vary | and that is expected |
| A long tail | means report the median |
Your turn: four questions
- Pause here and answer all four.
- Question 1 wants the reason, not just the word.
- Question 4 follows from your answer to question 3.
| Question | |
|---|---|
| 1 | A gym exit survey on exercise. Problem? |
| 2 | Minimum sample size, numerical variable? |
| 3 | For 2, 3, 3, 4, 48: mean and median? |
| 4 | Which of those describes the data better? |
Show answer
1. The sample is biased. Everyone leaving a gym exercises, so the sample cannot represent a population that includes people who do not. The result will overstate exercise however many people are asked. 2. At least 30. For a categorical variable you would want around 1,000. 3. The mean is 12, because the five values total 60. The median is 3, the middle value when they are in order. 4. The median. Four of the five values are below the mean, so the mean is not describing a typical value at all: it has been dragged up by the 48 on its own.
The answers
- It is biased: everyone leaving a gym exercises.
- At least thirty for a numerical variable.
- Mean twelve, median three.
- The median, because the mean sits above four of the five values.
Is your child on track?
Take the free placement test