Is this information any good? Bias, misleading graphs and risk

What this lesson covers
- Information is only as good as the data, the sample and the display behind it.
- A strong response weighs the evidence, names its limitations and can bring in a personal view.
Five questions for any information
- The exam asks about quality and limitations.
- These five questions find them.
- Ask all five, every time.
| Ask | Looking for |
|---|---|
| Who? | made it, and why |
| When? | is it still current |
| How many? | the sample size |
| How chosen? | random, or self-selected |
| What is missing? | base, units, comparisons |
How many were asked?
- A percentage hides the sample size.
- 9 of 10 and 900 of 1000 are both 90%.
- Small samples vary a lot by chance.
| Result | Percentage | Based on |
|---|---|---|
| 9 out of 10 | 90% | ten people |
| 900 out of 1000 | 90% | a thousand people |
| Same percentage | very different weight |
How were they chosen?
- A self-selected sample chose to reply.
- People with strong views reply more.
- It represents only those people.
| Online poll | on a sports website |
| Who replies | readers who care about sport |
| Result | "70% want a new stadium" |
| Represents | those readers, not all residents |
Say which way the bias pushes
- Not just "it is biased".
- Sports fans probably favour a stadium.
- So 70% is likely too high for all residents.
Graphs: the honest version
- Pass rates of 92% and 95%.
- Drawn from zero, the bars are nearly equal.
- Which is the truth: a small rise.
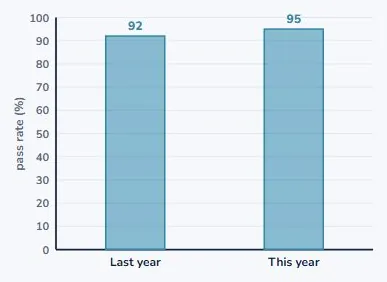
The truncated axis
- Start the axis at 90 instead.
- The bars become 2 and 5 units tall.
- 2.5 times bigger, for a 3% rise.
| Real values | 92% and 95% | |
| Axis starting at 90 | bars of 2 and 5 | looks 2.5 times |
| Really | 95 ÷ 92 = 1.03 | about 3% more |
Other ways graphs mislead
- Check the gaps between times.
- Check pictures are scaled fairly.
- Check labels and date ranges.
| Trick | Effect |
|---|---|
| Uneven time gaps | a jump looks sudden |
| Pictures scaled up | area grows faster than height |
| No axis labels | you cannot check it |
| Cherry-picked dates | the trend is hidden |
Relative and absolute risk
- "Risk doubles!" is a relative change.
- From 1 in 10 000 to 2 in 10 000.
- The absolute change is tiny.
| Risk | ||
|---|---|---|
| Before | 1 in 10 000 | |
| After | 2 in 10 000 | |
| Relative | "risk doubles!" | +100% |
| Absolute | 1 more in 10 000 | +0.01 points |
What is not there
- No sample size? No date? No base for the %?
- No comparison group?
- Missing information is a limitation. Name it.
Who made it, and when
- A company survey about its own product.
- Ten-year-old figures quoted as news.
- Neither is wrong, but both need a caution.
Considerations and worldview
- Who is affected, and who is left out?
- Your values can shape a recommendation.
- Label them as yours, beside the evidence.
Writing a critical response
- Say the claim is weakened, and why.
- Give the specific problem with numbers.
- Say what better information would show.
| Part | Contains |
|---|---|
| Point | the claim is weakened |
| Evidence | the specific problem, with numbers |
| Effect | which way it could mislead |
| Fix | what better information would show |
What to take away
- Check the source, the sample, the graph and the risk.
| Source | who made it, when, and why |
| Sample | how many, and how chosen |
| Self-selected | represents only those who replied |
| Axes | check where they start |
| Risk | ask for the absolute change |
| Missing | base, units, comparison |
| Worldview | your values, labelled as yours |
Your turn: four questions
- Pause here and answer each one.
- Question 2 has two answers.
- Say which way any bias pushes.
| Question | |
|---|---|
| 1 | "8 out of 10 owners said their cats prefer it." What is missing? |
| 2 | An axis starts at 50; bars show 55 and 60. Looks how many times? Really? |
| 3 | Risk rises from 3 in 1000 to 6 in 1000. Give the absolute change. |
| 4 | A sports website poll: 70% support a stadium. Why not all residents? |
Show answer
1. The sample size, how the owners were chosen, who asked and who paid, and what "prefer" was compared with. 2. Bars of 5 and 10, so it looks 2 times as big; really 60 ÷ 55 = 1.09, about 9% bigger. 3. Up 3 in 1000, which is 0.3 percentage points; the relative change is double. 4. It is self-selected: readers of a sports site chose to reply, and they are likely to favour a stadium more than residents in general.
The answers
- Sample size, how chosen, who asked, compared to what.
- Looks 2 times; really about 9% bigger.
- Up 3 in 1000: 0.3 percentage points.
- Self-selected sports fans: likely too high.
Is your child on track?
Take the free placement test