Interpreting box plots and scatter plots in the 91946 exam

What this lesson covers
- A claim about two groups needs evidence from the whole distribution, not from single values.
- A relationship shown in a display supports a claim only as far as its direction and strength go.
Three things the exam asks you to do
- Identify: read the right information.
- Relate: link your findings to the evidence.
- Critically engage: how good is it?
| Task | Means |
|---|---|
| Identify | read the right values |
| Relate | link findings to the evidence |
| Critically engage | quality, limits, other views |
The resource, and its claim
- A news article makes a claim.
- Two displays come with it.
- Does the evidence support the claim?
| In the resource | |
|---|---|
| Headline | "Driven students get to school faster" |
| Source 1 | box plots: trip time, bus and car |
| Source 2 | scatter: distance and trip time |
| Sample | 30 bus and 30 car students, one school |
Source 1: the box plots
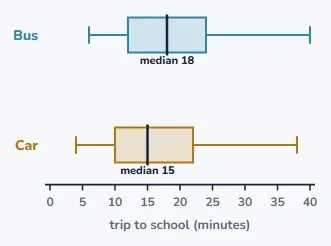
- Trip times for 30 bus and 30 car students.
- Same scale, so they can be compared.
- The car box sits only slightly lower.
Identify: read the values
- Medians: 18 minutes by bus, 15 by car.
- The middle halves are the same width.
- Give every value with its units.
| Bus | Car | |
|---|---|---|
| Median | 18 min | 15 min |
| Middle 50% | 12 to 24 | 10 to 22 |
| IQR | 12 min | 12 min |
| Range | 6 to 40 | 4 to 38 |
Relate: does it support the claim?
- Each median sits inside the other's box.
- So no call can be made.
- The claim is not supported by this sample.
| Check | Result |
|---|---|
| Car median, 15 | inside the bus box, 12 to 24 |
| Bus median, 18 | inside the car box, 10 to 22 |
| So | no call can be made |
| Claim | not supported by this sample |
Do not use one value
- "The fastest trip was by car, 4 minutes."
- That is one student, not a tendency.
- The examiner lists this as a Not Achieved habit.
Source 2: the scatter plot
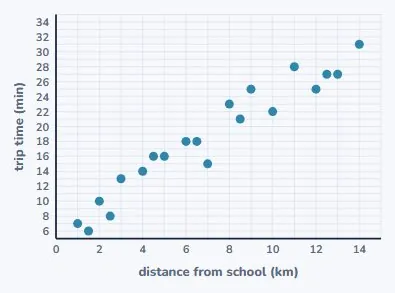
- Distance from school against trip time.
- Twenty students, one dot each.
- A clear upward pattern.
Describe the relationship
- Positive, and strong.
- About 2 more minutes for each kilometre.
- Distance seems to matter a lot.
| Feature | In context |
|---|---|
| Direction | positive: further takes longer |
| Strength | strong: close to a line |
| Rate | about 2 minutes a kilometre |
| So | distance matters more than mode |
Put the two sources together
- Mode made little clear difference.
- Distance made a big one.
- So the article may be looking at the wrong variable.
Critically engage
- One school, 60 students: a small sample.
- Were car students living closer?
- What does the article leave out?
Bringing in your own view
- Some questions ask for a personal worldview.
- Your values: cost, environment, independence.
- Stated as yours, alongside the evidence.
A justified recommendation
- Evidence from both sources.
- Your view, clearly labelled.
- A recommendation that follows from both.
| Evidence 1 | medians only 3 min apart, no call |
| Evidence 2 | distance strongly linked to time |
| Worldview | bus: cheaper, fewer cars at the gate |
| So | for most, the bus costs little time |
What to take away
- Identify, relate, engage, then recommend.
| Identify | medians, boxes, values, units |
| Test a claim | against the whole distribution |
| No call | medians inside each other's box |
| Scatter | direction, strength, rate |
| Two sources | use both to justify |
| Worldview | your values, stated as yours |
| Avoid | single values and "proves" |
Your turn: four questions
- A claim about gamers' reaction times.
- Pause here and answer each one.
- Lower reaction time means faster.
| Question | |
|---|---|
| Data | Reaction time (ms). Gamers: median 250, box 220 to 270. Others: median 290, box 260 to 320. |
| 1 | By how much do the medians differ? |
| 2 | Can you make a call? Explain with values. |
| 3 | Rewrite the claim "Gamers react faster" so it is justified. |
| 4 | A weak negative scatter of gaming hours and time. Proof? Why? |
Show answer
1. 290 − 250 = 40 ms. 2. Yes. The gamers' median, 250 ms, is below the others' box, which starts at 260, so gamers in this population tend to have faster (lower) reaction times. 3. For example: "In this sample, gamers tend to have faster reaction times than non-gamers, with a median of 250 ms compared with 290 ms." 4. No. A weak relationship means hours explain little of the variation, and an association does not show cause: age or sleep could affect both.
The answers
- 290 − 250 = 40 ms.
- Yes: 250 is below the other box, which starts at 260.
- "In this sample, gamers tend to react faster..."
- No: weak, and association is not cause.
Is your child on track?
Take the free placement test