Interpreting displays: 7 exam questions solved step by step
What this lesson covers
- A claim about two groups needs evidence from the whole distribution, not from single values.
- A relationship shown in a display supports a claim only as far as its direction and strength go.
7 displays, one method
- 1. Read the values, with units.
- 2. Work out the % or difference.
- 3. Say it in context: name the group.
- 4. Check the scale and the total.
Question 1 · Achieved
- A survey of 200 students at a school:
- do you play a sport for the school?
- What percentage of the Year 11
- students play sport?
| Year level | Sport | No sport | Total |
|---|---|---|---|
| Year 9 | 54 | 36 | 90 |
| Year 11 | 44 | 66 | 110 |
| Total | 98 | 102 | 200 |
Q1: Year 11 who play sport
- Find the right row.
- Divide by its row total.
- Year 11 who play sport: 44
- Year 11 total: 110the row total
- 44 ÷ 110 = 0.4part ÷ whole
- 0.4 × 100 = 40%
- 44 ÷ 200 = 22%200 is everyone
- 40% of Year 11 play sport
Question 2 · Achieved, in context
- Same survey, same table.
- Compare the percentages of Year 9
- and Year 11 students who play sport.
- Write the comparison in context.
| Year level | Sport | No sport | Total |
|---|---|---|---|
| Year 9 | 54 | 36 | 90 |
| Year 11 | 44 | 66 | 110 |
| Total | 98 | 102 | 200 |
Q2: Year 9 against Year 11
- Groups differ in size.
- So compare percentages.
- Year 9: 54 ÷ 90 = 0.6 = 60%
- Year 11: 44 ÷ 110 = 40%from question 1
- 60 − 40 = 20 percentage points
- 54 − 44 = 10 studentsgroup sizes differ
- Year 9 60%, Year 11 40%
Question 3 · Merit
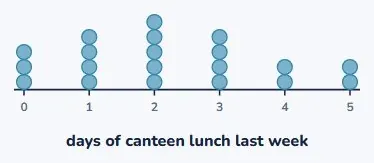
- 20 Year 11 students: days last week
- they bought canteen lunch.
- Claim: "Most bought lunch on 3+ days."
- Find the median. Is the claim right?
Q3: canteen lunches
- Count every dot.
- Most means over half.
- 0: 3, 1: 4, 2: 5, 3: 4, 4: 2, 5: 2
- 3 + 4 + 5 + 4 + 2 + 2 = 20
- median: 10th and 11th values
- 3 + 4 = 7, 7 + 5 = 12counting up
- median = 2 days
- 3 or more days: 4 + 2 + 2 = 8
- 8 ÷ 20 = 0.4 = 40%
- Not supported: only 40%under half
Question 4 · Merit
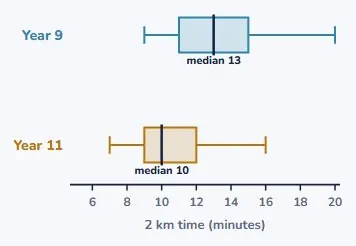
- 2 km time trial, in minutes:
- 20 Year 9 and 20 Year 11 students.
- Find each median and IQR.
- Call "Year 11 tend to be faster"?
Q4: read the box plots
- Read off the scale.
- IQR = Q3 − Q1.
- Year 9: Q1 11, median 13, Q3 15
- IQR = 15 − 11 = 4 minQ3 − Q1
- Year 11: Q1 9, median 10, Q3 12
- IQR = 12 − 9 = 3 minQ3 − Q1
- medians: 13 − 10 = 3 min
Q4: can we make a call?
- Lower time = faster.
- Median outside the box?
- medians: 13 − 10 = 3 min
- Year 11 median 10 < Year 9 Q1 11
- outside the Year 9 boxso we can make a call
- shorter time = faster
- IQR 3 < 4: less spread
- Year 11 tend to be faster
Question 5 · Merit, in context
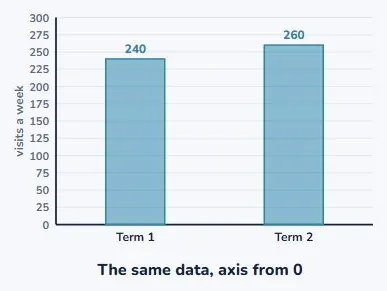
- Library visits a week:
- Term 1: 240, Term 2: 260.
- The newsletter graph starts at 230.
- Headline: "Visits have tripled!"
- Check the scale first.
Q5: has it tripled?
- The bars start at 230.
- Compare the real values.
- Term 1 bar: 240 − 230 = 10
- Term 2 bar: 260 − 230 = 30
- 30 ÷ 10 = 3why it looks tripled
- increase: 260 − 240 = 20
- 20 ÷ 240 × 100 ≈ 8.3%compared with Term 1
- 3 × 240 = 720, not 260
- "tripled"axis does not start at 0
- Up 20 visits a week, about 8%
Question 6 · Excellence
- 20 Year 11 students: paid work
- (hours a week), sleep (hours a night).
- Describe the relationship. Estimate
- sleep for 10 hours of work a week.
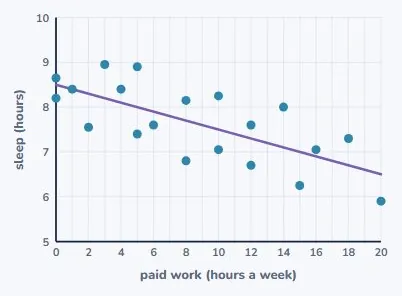
Q6: describe the relationship
- Direction, strength, rate.
- Read the trend line.
- direction: negativemore work, less sleep
- strength: moderateclear, but scattered
- trend: 8.5 h at 0, 6.5 h at 20
- drop = 8.5 − 6.5 = 2 hover 20 hours of work
- 2 ÷ 20 = 0.1 h per hourthe rate
- 0.1 × 60 = 6 minuteshours to minutes
Q6: estimate, then the caution
- Use the trend line.
- A link is not a cause.
- 0.1 × 60 = 6 minutes
- at 10 h: 8.5 − 0.1 × 10trend line
- = 8.5 − 1 = 7.5 hours
- 1 hour less than at 0 hours
- work causes less sleeplinked, not proven
- about 7.5 hours a night
Question 7 · Excellence
- A coach claims Year 11 students run
- faster because more of them play sport.
- Use the table and the box plots.
- Does the evidence support the claim?
| Finding | Year 9 | Year 11 |
|---|---|---|
| Play sport (Q1, Q2) | 60% | 40% |
| Median 2 km time (Q4) | 13 min | 10 min |
Q7: test each part of the claim
- Two parts, two displays.
- Does the reason fit?
- Year 11 faster? 10 < 13 min
- more Year 11 play sport40%, against 60%
- so the "because" fails
- more likely: older, stronger
- two samples, one schoola limitation
- Faster: yes. Because sport: no.
What solved all seven
- Read, calculate, compare, then say it in context.
| Step | How |
|---|---|
| Read | the values, with units |
| Right total | part ÷ that group's total |
| Compare | percentages, not counts |
| Box plots | median outside box: a call |
| Scale | does the axis start at 0? |
| Scatter | direction, strength, rate |
| In context | name the group, no "proves" |
Is your child on track?
Take the free placement test