Time series: 7 exam questions solved step by step
What this lesson covers
- A time series graph shows how one variable changes over time, and its features have names.
- Trend, seasonal pattern and unusual spikes are read separately and then described together.
One data set, 7 questions
- Guest nights at a holiday park.
- In hundreds, each quarter, 3 years.
- Q1 = Jan to Mar (summer).
- Invented data, for practice.
| Year | Q1 | Q2 | Q3 | Q4 |
|---|---|---|---|---|
| Year 1 | 15 | 9 | 4 | 11 |
| Year 2 | 18 | 11 | 7 | 14 |
| Year 3 | 21 | 14 | 2 | 16 |
Question 1 · Achieved
- Guest nights in Q1 of year 2?
- How many fewer in Q2 of year 2?
- Careful: the values are hundreds.
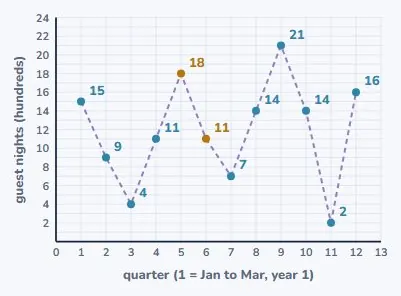
Q1: read, then × 100
- Values are in hundreds.
- A change: subtract.
- Year 2, Q1: 18 hundred
- 18 × 100 = 1800 guest nights
- Year 2, Q2: 11 hundred
- 11 × 100 = 1100 guest nights
- 1800 − 1100 = 700a change
- 700 fewer guest nights in Q2
Question 2 · Achieved, in context
- Describe the seasonal pattern.
- Give the size of the swing.
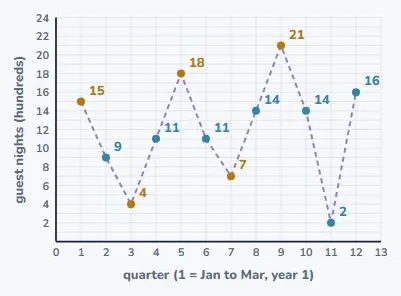
Q2: the seasonal pattern
- When high, when low?
- Then how big the swing is.
- Q1: 15, 18, 21highest every year
- Q3: 4, 7, 2lowest every year
- Year 1: 15 − 4 = 11peak − trough
- Year 2: 18 − 7 = 11peak − trough
- swing ≈ 11 hundred = 1100
- Peaks in summer (Jan to Mar),
- lowest in winter (Jul to Sep),
- by about 1100 guest nights.
Question 3 · Merit, in context
- Describe the trend, with a rate.
- Compare like quarters with like.
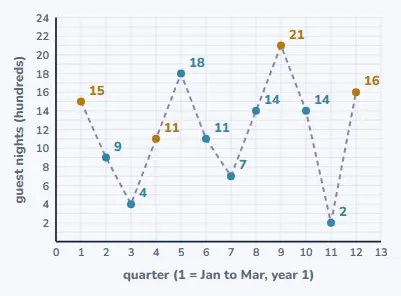
Q3: the trend as a rate
- Same quarter, other years.
- Leave the odd value out.
- Q1: 21 − 15 = 6 hundredover 2 years
- 6 ÷ 2 = 3 hundred a year
- Q4: 16 − 11 = 5 hundredover 2 years
- 5 ÷ 2 = 2.5 hundred a year
- Q2: 14 − 9 = 5, 2.5 a year
- Guest nights are increasing,
- by about 250 to 300 a year.
Question 4 · Merit
- Find the percentage increase in
- summer (Q1) guest nights,
- from year 1 to year 3.
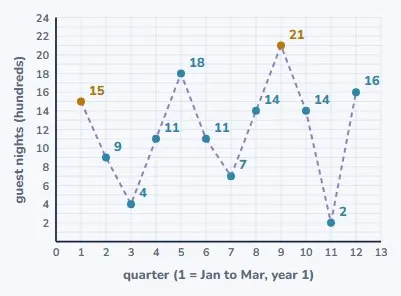
Q4: percentage change
- Change ÷ original × 100.
- Original = year 1.
- Q1, year 1: 1500
- Q1, year 3: 2100
- change = 2100 − 1500 = 600
- 600 ÷ 1500 × 100 = 40%change ÷ original
- 600 ÷ 2100 × 100 ≈ 28.6%wrong base
- 1500 × 1.4 = 2100
- Summer guest nights rose 40%.
Question 5 · Merit, in context
- One value does not fit the pattern.
- Find it, and how far off it is.
- Give a possible reason.
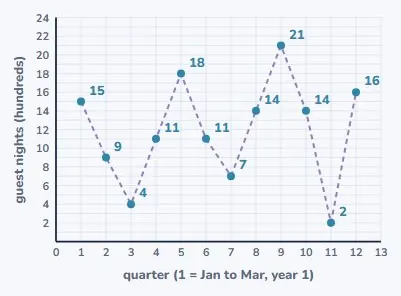
Q5: the unusual value
- Expected minus actual.
- A reason: say "possibly".
- Q3: 4, 7, then 2should keep rising
- 7 − 4 = 3 a yearQ3 years 1 to 2
- expected ≈ 7 + 3 = 10 hundred
- actual = 2 hundred
- 10 − 2 = 8 hundred below
- Winter, year 3: 200 nights,
- about 800 below the pattern.
- Possibly a road closure or storm.
Question 6 · Excellence, in context
- Predict the guest nights
- for Q1 of year 4.
- Justify it, and give its limits.
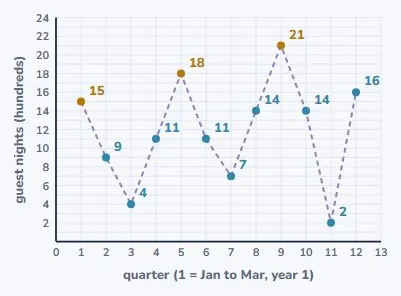
Q6: predict, with limits
- Latest same quarter,
- plus one year of trend.
- latest Q1: 21 hundredsame season
- trend: +3 hundred a yearfrom question 3
- 21 + 3 = 24 hundred
- ≈ 2400 guest nights
- Assumes the pattern carries on.
- Only 3 years of data.
- A shock (year 3, Q3) can recur.
- About 2400, one season ahead.
Question 7 · Excellence, in context
- The owner says year 3 was worse
- than year 2, as winter was poor.
- Use the data to evaluate this.
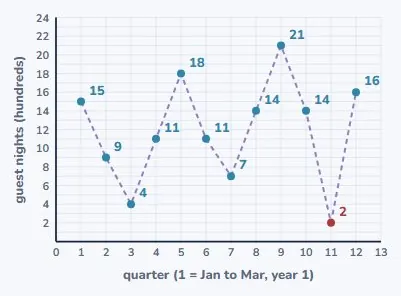
Q7: test the claim
- Whole years: add quarters.
- Then quarter by quarter.
- Year 2: 18 + 11 + 7 + 14 = 50
- Year 3: 21 + 14 + 2 + 16 = 53
- 53 − 50 = 3 hundred more
- Q1 +3, Q2 +3, Q4 +2all rose
- Q3: 7 → 2, down 5the only fall
- Q3 ≈ 10 gives 61 hundredhad it fitted
- Year 3: 5300, up 300.
- Not supported: only winter fell.
What answered all seven
- A number from the data, then a sentence in context.
| Step | How |
|---|---|
| Values | read, then × 100, with units |
| Season | when high, when low, how much |
| Trend | like quarter with like, a rate |
| Change | change ÷ original × 100 |
| Unusual | expected minus actual, reason |
| Predict | latest same quarter + trend |
| Limits | it assumes the pattern holds |
Is your child on track?
Take the free placement test