Comparing distributions: 7 exam questions solved step by step
What this lesson covers
- A distribution is described by its shape, centre and spread, each with numbers.
- Whether a normal model is appropriate depends on the shape of the data.
7 questions, one method
- 1. Shape: symmetric or skewed?
- 2. Centre: mean or median, with a number.
- 3. Spread: IQR or sd, with a number.
- 4. Both groups, in context, every time.
Question 1 · Achieved
- Waiting times at a medical clinic.
- Describe the shape.
- Which class holds the median?
- Which centre should you use?
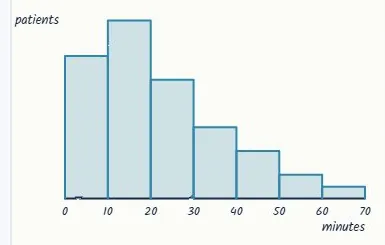
Q1: one histogram
- The tail names the skew.
- Count to the middle.
- 12 + 15 + 10 + 6 + 4 + 2 + 1
- = 50 patients
- peak: the 10 to 20 min class
- long tail to the rightout to 70 min
- shape: right-skewed
- median: 25th and 26th values
- cumulative 12, 2712 < 25, 27 ≥ 26
- median in the 10 to 20 min class
- skewed: use the median
Question 2 · Achieved, in context
- Commute times, 30 days by bus
- and 30 days by car.
- Compare the typical commute times.
| Bus | Car | |
|---|---|---|
| Minimum | 38 min | 30 min |
| Lower quartile | 42 min | 36 min |
| Median | 45 min | 43 min |
| Upper quartile | 48 min | 55 min |
| Maximum | 56 min | 72 min |
Q2: compare the centres
- Typical means the centre.
- Name both, with units.
- bus median = 45 minfrom the table
- car median = 43 min
- 45 − 43 = 2 minthe difference
- car median is 2 min lower
Question 3 · Merit, in context
- The same bus and car times.
- Compare the spreads, with numbers.
- Which way is more reliable?
| Bus | Car | |
|---|---|---|
| Minimum | 38 min | 30 min |
| Lower quartile | 42 min | 36 min |
| Median | 45 min | 43 min |
| Upper quartile | 48 min | 55 min |
| Maximum | 56 min | 72 min |
Q3: compare the spreads
- IQR: the middle half.
- Spread, not centre.
- IQR = UQ − LQ
- bus: 48 − 42 = 6 min
- car: 55 − 36 = 19 min
- range: bus 56 − 38 = 18 min
- range: car 72 − 30 = 42 min
- 19 ÷ 6 ≈ 3.2times as wide
- car times far more variable
- the bus is more reliableonly 2 min slower
Question 4 · Merit
- Fish caught on 30 charter trips.
- Find the mean and the median.
- What do they say about the shape?
| Fish caught | Trips |
|---|---|
| 0 | 3 |
| 1 | 6 |
| 2 | 8 |
| 3 | 5 |
| 4 | 4 |
| 5 | 2 |
| 6 | 2 |
Q4: mean against median
- Mean: Σfx ÷ n.
- Median: count to the middle.
- n = 3 + 6 + 8 + 5 + 4 + 2 + 2 = 30
- Σfx = 3×0 + 6×1 + 8×2 + 5×3
- + 4×4 + 2×5 + 2×6
- = 75
- mean = 75 ÷ 30 = 2.5 fish
- median: 15th and 16th values
- cumulative 3, 9, 179 < 15, 17 ≥ 16
- median = 2 fish
- mean 2.5 > median 2right-skewed
Question 5 · Merit, in context
- Kiwifruit weights from two orchards.
- Compare the shape, centre and spread,
- with numbers.
| Orchard A | Orchard B | |
|---|---|---|
| Mean | 104 g | 112 g |
| Median | 104 g | 115 g |
| Standard deviation | 6 g | 11 g |
Q5: shape, centre, spread
- Mean against median: shape.
- Skewed: compare medians.
- A: mean 104 = median 104symmetric
- B: mean 112 < median 115left-skewed
- medians: 104 g and 115 gB is skewed
- 115 − 104 = 11 g
- sd: 6 g and 11 g
- 11 ÷ 6 ≈ 1.8nearly twice
- Shape: A symmetric, B left-skewed
- Centre: B 11 g heaviermedians
- Spread: B more variablesd 11 g against 6 g
Question 6 · Excellence
- Back to the clinic waiting times.
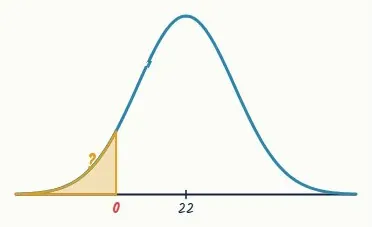
- Is a normal model appropriate?
- Justify with numbers.
Q6: the mean and sd
- Grouped data: midpoints.
- sd from the calculator.
- midpoints 5, 15, 25, …, 65class middles
- Σfx = 12×5 + 15×15 + 10×25
- + 6×35 + 4×45 + 2×55 + 1×65
- = 1100
- mean = 1100 ÷ 50 = 22.0 min
- s = 15.2864 mincalculator
- mean 22.0 > median classright skew
Q6: test the model
- What does the model predict?
- Compare with reality.
- μ = 22.0, σ = 15.2864from the data
- z = (0 − 22.0) ÷ 15.2864
- = −1.4392
- P(X < 0) = 0.0750waits cannot be < 0
- model: P(X > 50) = 0.0335
- data: 3 ÷ 50 = 0.06the top two classes
- normal model not appropriate
Question 7 · Excellence
- Weekly rents ($) for 9 Hamilton flats:
- 420 450 460 480 490 500 520 540 560
- Add a tenth flat at $1500 a week.
- Compare mean and median. Which is better?
Q7: before and after
- Recalculate both.
- n goes from 9 to 10.
- sum = 44209 rents
- mean = 4420 ÷ 9 = $491.11
- median = 5th value = $490
- with $1500: sum = 5920
- mean = 5920 ÷ 10 = $592
- median = (490 + 500) ÷ 25th and 6th
- = $495
Q7: which centre?
- One value, two effects.
- Say it in context.
- mean: 592 − 491.11 = $100.89
- median: 495 − 490 = $5
- one rent moved the meanthe median resists
- 9 of 10 rents are under $592
- use the median: $495 a week
The method that solved all seven
- Shape, centre and spread: numbers, both groups, in context.
| Step | How |
|---|---|
| Shape | symmetric or skewed, which way |
| Centre | the median when skewed |
| Spread | IQR or sd, with numbers |
| Compare | both groups in every sentence |
| Normal fit | symmetric, one peak, sensible |
| Outliers | move the mean, not the median |
Is your child on track?
Take the free placement test