Comparing two samples
What this lesson covers
- Compare shift, overlap and spread on the box plots.
- Intervals that do not overlap support a claim.
- Overlapping intervals leave the question open.
What to compare
- Centre: how far apart are the medians?
- Spread: is one group more variable?
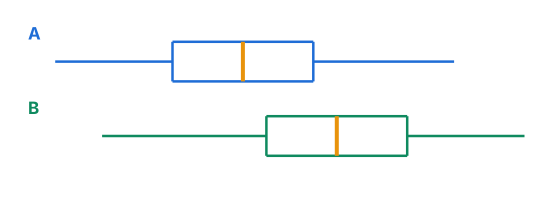
- Overlap: how much do the boxes overlap?
Try it: two samples will differ
Using the intervals
- Two groups give these intervals for the median.
| Group | Median | Interval |
|---|---|---|
| A | 64 | 60 to 68 |
| B | 72 | 69 to 75 |
Try it: shift and overlap
Reading the result
- The intervals do not overlap.
- A: 60 to 68
- B: 69 to 75
- B tends to be higher in the population
Seeing the shift
- B sits to the right of A, but the boxes overlap, so check the intervals.
Statistics explorer
Common mistakes
- Claiming B is always higher.Say B tends to be higher, because individuals vary.
- Claiming no difference when intervals overlap.Overlap means there is not enough evidence to decide.
Your turn
Intervals are 10 to 14 and 15 to 19. What can you say?
Intervals are 20 to 30 and 25 to 35. What can you say?
Which wording is best?
Which feature compares centre?
Show answer
1. No overlap, so the second tends to be higher 2. They overlap, so we cannot claim a difference 3. B tends to be higher than A 4. The medians
Sample question: Achieved
Random samples from two populations give informal confidence intervals for the median of 52 to 60 and 63 to 71. What can you conclude?
Hint
Check whether the two intervals overlap.
Answer
The intervals do not overlap, so the second population tends to have higher values than the first
Step by step
- Each interval is a likely range for one population median.
- Compare the ends: the first interval stops at 60, and the second starts at 63.
- 60 is less than 63, so there is a gap. The intervals do not overlap.
- No overlap means the second population median is very likely higher, so we can make a claim.
- Say it carefully: "The second population tends to have higher values than the first."
- The classic mistake is to say every value in the second population is higher. Individuals vary, so say "tends to be".
- Check: the medians are 56 and 67, and the second is the higher one, which agrees.
Full working
- first: 52 to 60, second: 63 to 71
- 60 < 63no overlap
- The second tends to be higher
Sample questions: Merit
Random samples of 36 Year 12 girls and 36 Year 12 boys at a school recorded hours of sleep on a school night. Girls: median 7.6, IQR 1.2. Boys: median 7.0, IQR 1.6. Construct both informal confidence intervals and decide whether you can claim that girls at the school tend to sleep longer than boys.
Hint
Find both intervals with median ± 1.5 × IQR ÷ √n, then check for overlap.
Answer
Girls 7.3 to 7.9 hours, boys 6.6 to 7.4 hours; they overlap, so we cannot make the claim
Step by step
- Recall the informal interval: median ± 1.5 × IQR ÷ √n. Both samples have n = 36, so √n = 6.
- Girls: margin = 1.5 × 1.2 ÷ 6 = 0.3. Interval 7.6 − 0.3 = 7.3 to 7.6 + 0.3 = 7.9 hours.
- Boys: margin = 1.5 × 1.6 ÷ 6 = 0.4. Interval 7.0 − 0.4 = 6.6 to 7.0 + 0.4 = 7.4 hours.
- Compare: the boys' interval reaches 7.4, and the girls' starts at 7.3. They overlap from 7.3 to 7.4.
- Overlap means the population medians could be the same, so the data does not give enough evidence.
- Conclusion: we cannot claim that Year 12 girls at this school tend to sleep longer than boys.
- The classic mistake is to claim "no difference". Overlap does not prove the medians are equal; it means we cannot tell.
- A larger sample would give narrower intervals and might settle it.
- Check: the sample medians do differ by 0.6 hours, which is why it is a close call.
Full working
- √36 = 6
- girls: 7.6 ± 1.5 × 1.2 ÷ 6 = 7.6 ± 0.3, so 7.3 to 7.9
- boys: 7.0 ± 1.5 × 1.6 ÷ 6 = 7.0 ± 0.4, so 6.6 to 7.4
- 7.4 > 7.3the intervals overlap
- Overlap: not enough evidence to claim girls sleep longer
Two random samples recorded the time, in seconds, to solve a puzzle. Group A: n = 25, median 48, IQR 10. Group B: n = 100, median 53, IQR 12. Construct both informal confidence intervals and make a conclusion. Explain why group B's interval is narrower even though its IQR is bigger.
Hint
Each interval uses its own n. Compare the end of A's interval with the start of B's.
Answer
A: 45 to 51 s, B: 51.2 to 54.8 s; no overlap, so group B tends to take longer; B is narrower because its sample is four times as big
Step by step
- Recall median ± 1.5 × IQR ÷ √n. Use each group's own numbers.
- Group A: √25 = 5, margin 1.5 × 10 ÷ 5 = 3. Interval 45 to 51 seconds.
- Group B: √100 = 10, margin 1.5 × 12 ÷ 10 = 1.8. Interval 51.2 to 54.8 seconds.
- A ends at 51 and B starts at 51.2. There is a small gap, so the intervals do not overlap.
- Conclusion: group B tends to take longer to solve the puzzle than group A.
- Why B is narrower: its IQR is 1.2 times bigger, but √100 is twice √25. The bigger sample wins, so B's margin is smaller.
- The gap is very small, 0.2 seconds, so the claim is only just supported. A careful report would say so.
- The classic mistake is to use the same n for both groups. Each interval comes from its own sample size.
Full working
- A: 48 ± 1.5 × 10 ÷ 5 = 48 ± 3, so 45 to 51
- B: 53 ± 1.5 × 12 ÷ 10 = 53 ± 1.8, so 51.2 to 54.8
- 51 < 51.2no overlap, only just
- √100 ÷ √25 = 2 > 12 ÷ 10the bigger sample narrows B
- B tends to take longer
Sample questions: Excellence
Year 12 girls had median sleep 7.6 hours with IQR 1.2 hours, and boys had median 7.0 hours with IQR 1.6 hours. With samples of 36 each, the intervals overlapped. Suppose a new study takes equal random samples of n girls and n boys and gets the same medians and IQRs. Find the smallest n for which the intervals would not overlap. Explain why this does not guarantee the new study will support the claim.
Hint
Write the top of the boys' interval and the bottom of the girls' interval in terms of √n, and solve top < bottom.
Answer
n = 50 each; but a new sample would give different medians and IQRs, so the result is not guaranteed
Step by step
- No overlap means the boys' upper end is below the girls' lower end.
- Boys' upper end: 7.0 + 1.5 × 1.6 ÷ √n = 7.0 + 2.4 ÷ √n.
- Girls' lower end: 7.6 − 1.5 × 1.2 ÷ √n = 7.6 − 1.8 ÷ √n.
- Set up the inequality: 7.0 + 2.4 ÷ √n < 7.6 − 1.8 ÷ √n.
- Collect the √n terms on one side: 4.2 ÷ √n < 0.6.
- Rearrange: √n > 4.2 ÷ 0.6 = 7, so n > 49.
- At n = 49 the two ends are both exactly 7.343, so they touch. The smallest whole number is n = 50 each.
- Check n = 50: boys' upper end 7.0 + 2.4 ÷ 7.071 = 7.339, girls' lower end 7.6 − 1.8 ÷ 7.071 = 7.345. A tiny gap.
- Why not guaranteed: a new sample would have its own medians and IQRs. The 0.6-hour difference could shrink or grow just from sampling variation.
- Also, at n = 50 the gap is tiny, so a slightly different sample could overlap again. A safer plan is a larger sample.
- The classic mistake is to solve with the margins of the 36-person samples. The margins must change with n.
Full working
- boys' top: 7.0 + 2.4 ÷ √n; girls' bottom: 7.6 − 1.8 ÷ √n
- 7.0 + 2.4 ÷ √n < 7.6 − 1.8 ÷ √nno overlap
- 4.2 ÷ √n < 0.6, √n > 7
- n > 49at n = 49 the ends touch
- n = 50: 7.339 < 7.345
- n = 50 each
Random samples of 36 students from each of two schools recorded their travel time to school in minutes. School X: minimum 5, lower quartile 12, median 20, upper quartile 30, maximum 62. School Y: minimum 8, lower quartile 22, median 30, upper quartile 40, maximum 75. Write a conclusion to "Do students at School Y tend to take longer to get to school than students at School X?", using shift, overlap, spread and the intervals, and discuss the sampling.
Hint
Compare the boxes first, then build both intervals. Finish with what the sampling allows you to claim.
Answer
Yes: the intervals, 15.5 to 24.5 minutes for X and 25.5 to 34.5 minutes for Y, do not overlap, so Y students tend to take longer, by a median of about 10 minutes in the samples
Step by step
- Shift: Y's median, 30, is 10 minutes more than X's median, 20.
- Overlap: X's box is 12 to 30 and Y's is 22 to 40. The boxes overlap from 22 to 30, so many individual students take similar times.
- Spread: both IQRs are 18 minutes (30 − 12 and 40 − 22), so the middle halves are equally spread. Both have a long upper tail, to 62 and 75.
- Intervals: n = 36, √n = 6, margin 1.5 × 18 ÷ 6 = 4.5 for both.
- X: 20 ± 4.5, which is 15.5 to 24.5 minutes. Y: 30 ± 4.5, which is 25.5 to 34.5 minutes.
- 24.5 is less than 25.5, so the intervals do not overlap. That is strong enough to make the claim even though the boxes overlap.
- Conclusion: students at School Y tend to take longer to get to school than students at School X. I estimate the median for Y is 25.5 to 34.5 minutes and for X 15.5 to 24.5 minutes.
- Sampling: the samples were random, so they should represent each school. The claim applies to these two schools only, not to all NZ students.
- Limitations: travel time may be self-reported and rounded, and it may change with the season or the weather.
- The classic mistake is to say "Y students always take longer". Some X students take longer than most Y students, so say "tend to".
Full working
- median Y 30, median X 20shift of 10 min
- boxes overlap 22 to 30individuals vary
- IQR 18 for bothsame spread
- X: 20 ± 4.5 = 15.5 to 24.5; Y: 30 ± 4.5 = 25.5 to 34.5
- 24.5 < 25.5intervals do not overlap
- random samples, these two schools only
- Y students tend to take longer
What to take away
- No overlap supports a claim.
- Overlap means we cannot tell.
Practise this
Report a mistake
More in AS 91264
Is your child on track?
Take the free placement test