Comparing distributions: shape, centre and spread
What this lesson covers
- A distribution is described by its shape, centre and spread, each with numbers.
- Whether a normal model is appropriate depends on the shape of the data.
Describe with three words, and numbers
- Shape, centre and spread.
- Every feature needs a number.
- Every comparison needs both groups.
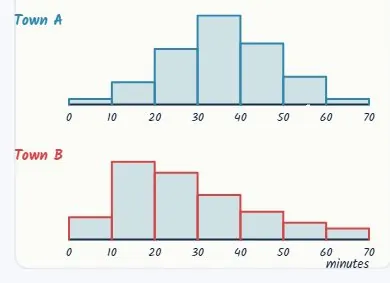
Commute times in two towns
- Town A: a single hump in the middle.
- Town B: piled up on the left, a long tail right.
- Same scale, 48 workers each.
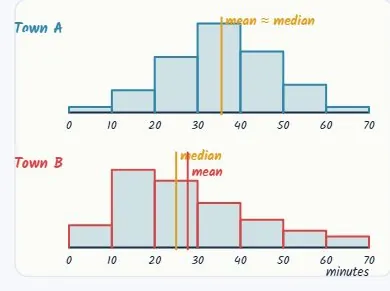
Where the mean and median sit
- Town A: mean and median together, about 35.
- Town B: median about 25, mean 27.7.
- The tail drags B's mean to the right.
The means from grouped data
- Use each class midpoint.
- Σ count × midpoint, ÷ 48.
- midpoints 5, 15, 25, …, 65class middles
- A: 1×5 + 4×15 + 10×25 + 16×35
- + 11×45 + 5×55 + 1×65
- = 1710
- mean = 1710 ÷ 48 = 35.6 min
- B: 4×5 + 14×15 + 12×25 + 8×35
- + 5×45 + 3×55 + 2×65
- = 1330
- mean = 1330 ÷ 48 = 27.7 min
The medians from grouped data
- The middle: 24th, 25th.
- Use cumulative counts.
- n = 48: 24th and 25th values
- A: cumulative 1, 5, 15, 31
- both in the 30–40 class15 < 24, 31 ≥ 25
- A: median ≈ 35 minclass middle
- B: cumulative 4, 18, 30
- both in the 20–30 class18 < 24, 30 ≥ 25
- B: median ≈ 25 minclass middle
- B: mean 27.7 > median 25right skew
The summary statistics
- Estimated from the grouped data.
- Means, medians and standard deviations.
- These are the numbers for your sentences.
| Town A | Town B | |
|---|---|---|
| Mean | 35.6 min | 27.7 min |
| Median | about 35 min | about 25 min |
| Standard deviation | 12.6 min | 15.5 min |
| Shape | symmetric | right-skewed |
Shape: symmetric or skewed
- The tail names the skew: right tail, right skew.
- Skew pulls the mean towards the tail.
- So mean > median signals right skew.
| Shape | Looks like | Here |
|---|---|---|
| Symmetric | mean ≈ median | Town A |
| Right-skewed | right tail, mean > median | Town B |
| Left-skewed | left tail, mean < median |
Which centre to use
- Symmetric data: mean or median, they agree.
- Skewed data: the median.
- A few long commutes do not move the median.
Spread, with a number
- Town B: standard deviation 15.5 minutes.
- Town A: 12.6 minutes.
- B's commutes are more variable.
A full comparison
- One sentence per feature.
- Both towns in every sentence.
- A number in every sentence.
| Feature | Comparison |
|---|---|
| Shape | A symmetric; B skewed right |
| Centre | A median about 10 min higher |
| Spread | B more variable: sd 15.5 vs 12.6 |
| Unusual | B has a few very long commutes |
Is a normal model appropriate?
- A normal model is symmetric with one peak.
- Town A fits that; Town B does not.
- Saying why is an Excellence point.
| Shape | So | |
|---|---|---|
| Town A | symmetric, one peak | normal model fits |
| Town B | skewed | normal model does not fit |
Where the marks are
- Achieved: one feature compared.
- Merit: two features, with numbers.
- Excellence: all three, plus the model's fit.
What to take away
- Shape, centre, spread: both groups, with numbers.
| Shape | symmetric or skewed, and which way |
| Centre | median for skewed data |
| Spread | sd or IQR, with numbers |
| Skew | pulls the mean towards the tail |
| Compare | every feature, both groups, numbers |
| Normal model | only for symmetric, one-peaked data |
Your turn: four questions
- Pause here and answer each one.
- Use numbers from the summary.
- Name both classes every time.
| Question | |
|---|---|
| X | mean 64, median 65, sd 8, symmetric |
| Y | mean 58, median 54, sd 14, right-skewed |
| 1 | Compare the centres, with numbers. |
| 2 | Compare the spreads, with numbers. |
| 3 | Which class suits a normal model? Why? |
| 4 | Why is Y's mean higher than its median? |
Show answer
1. X is higher: median 65 against 54, 11 marks more. 2. Y is more spread out: standard deviation 14 against 8. 3. X: it is symmetric (mean close to median). Y is skewed, so normal model does not fit. 4. The right skew: a few high marks pull the mean up, while the median is not affected by them.
The answers
- 1. X median 65, Y median 54
- 65 − 54 = 11: X is 11 higher
- 2. sd: Y 14, X 8
- Y is more spread out
- 3. X: mean 64, median 65close: symmetric
- X suits a normal model
- Y is skewed, so it does not
- 4. Y: mean 58 > median 54right skew
- high marks pull the mean up
Is your child on track?
Take the free placement test