Relative risk: above 1, below 1, and evaluating a claim
What this lesson covers
- Relative risk compares the risk in one group with the risk in another by dividing.
- A relative risk above 1 means higher risk for the first group; below 1 means lower.
Comparing risk between groups
- Risk is a probability of something bad.
- Relative risk compares two groups.
- Divide one risk by the other.
Phones and crashes
- 2000 drivers, followed for a year.
- 400 used a phone while driving.
- 36 of them crashed; 48 of the other 1600 did.
| Crashed | Did not | Total | |
|---|---|---|---|
| Used a phone | 36 | 364 | 400 |
| Did not | 48 | 1552 | 1600 |
Two risks, then divide
- Each group, its own total.
- Then divide the risks.
- others: 2000 − 400 = 1600group total
- risk, phone = 36 ÷ 400crashed ÷ group
- = 0.09
- risk, others = 48 ÷ 1600crashed ÷ group
- = 0.03
- RR = 0.09 ÷ 0.03phone ÷ others
- = 3
Three times the risk
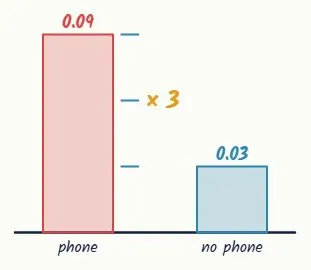
- Phone users: 9 in every 100 crashed.
- Others: 3 in every 100.
- Three of the small bars make the tall one.
"Three times as likely", not "3% more"
- RR 3: three times as likely.
- Not "3% more".
- RR = 0.09 ÷ 0.03 = 3times as likely
- difference = 0.09 − 0.03absolute
- = 0.06: 6 in every 100
- no crash: 400 − 36 = 364phone users
- 364 ÷ 400 = 0.9191% did not crash
A relative risk below 1
- Helmet ÷ no helmet.
- Below 1: a lower risk.
- risk, helmet = 10 ÷ 500injured ÷ group
- = 0.02
- risk, no helmet = 20 ÷ 250injured ÷ group
- = 0.08
- RR = 0.02 ÷ 0.08helmet ÷ no helmet
- = 0.25
- 1 − 0.25 = 0.7575% lower risk
Reading a relative risk below 1
- 0.25: a quarter of the risk.
- Or: the risk is 75% lower.
- The group on top is the one being described.
| Relative risk | Means | Example |
|---|---|---|
| RR > 1 | first group at higher risk | 3: three times as likely |
| RR = 1 | same risk | no difference |
| RR < 1 | first group at lower risk | 0.25: a quarter of the risk |
Which group goes on top?
- Name both groups.
- Same order as the division.
- helmet vs none: 0.02 ÷ 0.08
- = 0.25a quarter of the risk
- none vs helmet: 0.08 ÷ 0.02
- = 4four times as likely
- 1 ÷ 0.25 = 4the same fact
Evaluating "phones triple your crash risk"
- The number supports it, in this sample.
- But how were drivers chosen? Is it cause?
- And 91% of phone users did not crash.
| Check | Here | So |
|---|---|---|
| The number | RR = 3 in this sample | supports "three times" |
| The sample | which drivers, how chosen? | may not represent all |
| Cause | observational data | cannot prove cause |
| Absolute | 9% against 3% | 91% did not crash |
Where the marks are
- Achieved: calculate risks from a table.
- Merit: the relative risk, interpreted.
- Excellence: evaluate the claim itself.
What to take away
- Divide the risks, name the groups, question the claim.
| Risk | cases ÷ group total |
| Relative risk | risk in group 1 ÷ risk in group 2 |
| Above 1 | first group more at risk |
| Below 1 | first group less at risk |
| Say | "times as likely", not "% more" |
| Evaluate | sample, cause, absolute risk |
Your turn: four questions
- Pause here and answer each one.
- Each risk uses its own group total.
- Question 4: interpret, and give a limitation.
| Question | |
|---|---|
| Data | Exercisers: 30 of 200 had a cold. Others: 75 of 300. |
| 1 | Find the risk of a cold for people who exercise. |
| 2 | Find the risk for people who do not. |
| 3 | Find the relative risk, exercisers compared with others. |
| 4 | Interpret it in a sentence, with one limitation. |
Show answer
1. 30 ÷ 200 = 0.15. 2. 75 ÷ 300 = 0.25. 3. 0.15 ÷ 0.25 = 0.6. 4. In this sample, people who exercise were 0.6 times as likely to catch a cold (a 40% lower risk). The data cannot show exercise causes it; other factors may differ between the groups.
The answers: questions 1 to 3
- 1. risk = 30 ÷ 200exercisers
- = 0.15
- 2. risk = 75 ÷ 300others
- = 0.25
- 3. RR = 0.15 ÷ 0.25exercisers ÷ others
- = 0.6
The answers: question 4
- 4. RR = 0.6, below 1a lower risk
- 1 − 0.6 = 0.440% lower
- In this sample, exercisers were
- 0.6 times as likely to get a cold
- Limitation: not an experiment,
- so it cannot show cause.
- Other factors may differ.
Is your child on track?
Take the free placement test