The normal distribution: probabilities and z-values
What this lesson covers
- A normal distribution is symmetric about its mean, and its spread is measured by the standard deviation.
- A z-value counts how many standard deviations a value is from the mean.
The bell curve
- Many measurements pile up around the mean.
- Fewer and fewer as you go further out.
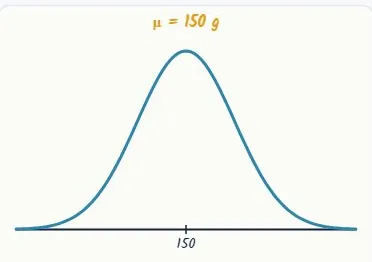
- Apple weights: mean 150 g, sd 12 g.
Shape, centre and spread
- Symmetric about the mean.
- The standard deviation sets the width.
- The total area under the curve is 1.
| Feature | Is | Apples |
|---|---|---|
| Shape | symmetric bell | mean = median = mode |
| Centre | the mean μ | 150 g |
| Spread | standard deviation σ | 12 g |
| Total area | 1 | all apples |
A z-value counts standard deviations
- Above the mean: positive.
- Below the mean: negative.
- z = (x − μ) ÷ σ
- z = (165 − 150) ÷ 12x = 165
- = 15 ÷ 12 = 1.25
- z = (140 − 150) ÷ 12x = 140
- = −10 ÷ 12 = −0.8333below: negative
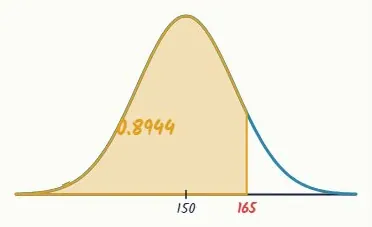
P(X < 165)
- Shade everything to the left of 165.
- More than half the area, so over 0.5.
- 0.8944.
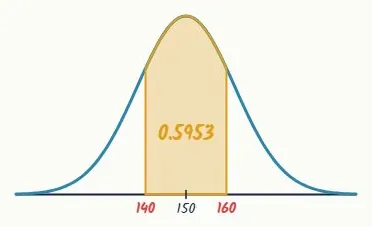
P(140 < X < 160)
- Shade between the two values.
- z from −0.8333 to 0.8333.
- 0.5953.
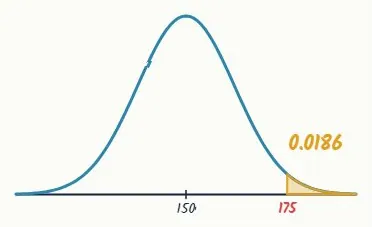
P(X > 175)
- A thin tail on the right.
- z = 2.0833: over two sd above.
- Small, as the picture says: 0.0186.
The working: below and between
- Calculator: normal cdf.
- Lower and upper bounds.
- z = (165 − 150) ÷ 12 = 1.25
- lower −1E99, upper 165μ = 150, σ = 12
- P(X < 165) = 0.8944
- z = (140 − 150) ÷ 12 = −0.8333
- z = (160 − 150) ÷ 12 = 0.8333
- lower 140, upper 160μ = 150, σ = 12
- P(140 < X < 160) = 0.5953
The working: above
- Above: upper bound 1E99.
- Check: 1 − P(X < 175).
- z = (175 − 150) ÷ 12
- = 25 ÷ 12 = 2.0833
- lower 175, upper 1E99μ = 150, σ = 12
- P(X > 175) = 0.0186
- 1 − P(X < 175) = 1 − 0.9814
- = 0.0186
Does it match the picture?
- Shaded more than half? Answer over 0.5.
- A thin tail? A small answer.
- A mismatch means a wrong sign or side.
Expected numbers from a normal model
- Expected = n × probability.
- Round to whole apples.
- P(X > 175) = 0.0186from before
- expected = 1000 × 0.0186
- = 18.6
- about 19 applesapples are whole
Where the marks are
- Achieved: a basic normal probability.
- Merit: in context, with z signs right.
- Excellence: annotated diagrams and interpretation.
What to take away
- Draw it, shade it, then calculate it.
| Draw it | shade the area you want |
| z | (x − μ) ÷ σ, with a sign |
| Below the mean | negative z |
| Probability | the shaded area |
| Check | more or less than 0.5? |
| Expected number | n × probability |
Your turn: four questions
- Sketch and shade each one first.
- Pause here and answer each one.
- Four decimal places.
| Question | |
|---|---|
| Data | Heights of Year 12 students: normal, mean 170 cm, sd 8 cm. |
| 1 | P(a student is taller than 180 cm)? |
| 2 | P(a student is shorter than 160 cm)? |
| 3 | P(between 165 and 175 cm)? |
| 4 | Of 500 students, how many are expected to be over 180 cm? |
Show answer
1. z = 1.25, so 0.1056. 2. z = −1.25, so 0.1056 (by symmetry, the same as question 1). 3. z from −0.625 to 0.625: 0.4680. 4. 500 × 0.1056 = 52.8, about 53 students.
The answers: questions 1 and 2
- 1. z = (180 − 170) ÷ 8 = 1.25
- lower 180, upper 1E99μ = 170, σ = 8
- P(X > 180) = 0.1056
- 2. z = (160 − 170) ÷ 8 = −1.25
- lower −1E99, upper 160μ = 170, σ = 8
- P(X < 160) = 0.1056symmetry with 1
The answers: questions 3 and 4
- 3. z = (165 − 170) ÷ 8 = −0.625
- z = (175 − 170) ÷ 8 = 0.625
- lower 165, upper 175μ = 170, σ = 8
- P(165 < X < 175) = 0.4680
- 4. expected = 500 × 0.1056
- = 52.8
- about 53 studentsstudents are whole
Is your child on track?
Take the free placement test