Evaluating a relationship

What this lesson covers
- r² gives the share of variation the line explains.
- A curved residual pattern means a line does not fit.
- Look for other variables.
Strength for the study data
- Use r and r².
- r = 0.994
- r² = 0.989
- The line explains about 99% of the variation, on only 5 points
Questions to ask
- Are there outliers pulling the line?
- Do the residuals show a pattern?
- Are there separate groups?
- Could a third variable explain the link?
When a line is the wrong model
- Plot residuals against x. A random scatter supports a line. A curve means a different model is needed.
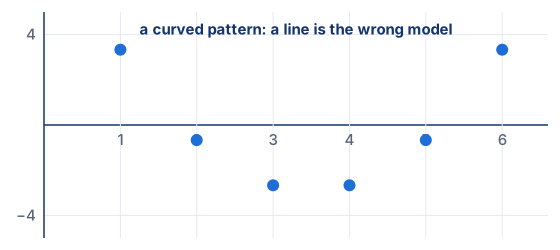
Try it: when a line is wrong
Looking for a third variable
- Ice cream sales and drownings both rise together in an invented town.
- Temperature rises in summer
- Hot weather lifts ice cream sales
- Hot weather means more swimming
- The link is explained by a third variable
Try it: one point changes r
Common mistakes
- Trusting a high r from few points.Small samples can mislead.
- Ignoring a curve in the residuals.Try a different model.
Your turn
r = 0.9. Find r².
r² = 0.81. What does it mean?
Residuals form a curve. What does that suggest?
Which is a lurking variable for ice cream and drownings?
Show answer
1. 0.81 2. The line explains about 81% of the variation 3. A straight line is not the right model 4. Temperature
Sample question: Achieved
For 30 Year 12 students, daily screen time and hours of sleep have r = −0.85. Find r² and explain what it means in context.
Hint
Square r. Then say it as a percentage of the variation in sleep that the line explains.
Answer
r² = 0.7225, so about 72% of the variation in students' sleep is explained by the straight-line relationship with screen time. The other 28% comes from other things.
Step by step
- r² is the square of the correlation coefficient. It tells us how much of the variation in y the line explains.
- r² = (−0.85)² = 0.7225.
- Classic mistake: thinking r² is negative because r is. Squaring always gives a positive number.
- As a percentage: 0.7225 is about 72%.
- Here y is hours of sleep, so about 72% of the differences in sleep between these students go along with their screen time, on the line.
- The other 28% is due to other things, such as sport, part-time work or simply different sleep needs.
- It does not show that screen time causes less sleep. It measures how well the line fits.
- Check: r² must be between 0 and 1, and 0.7225 is.
Full working
- r² = (−0.85)² = 0.7225
- 0.7225 ≈ 72%share of variation explained
- remaining 28% from other variables
- r² ≈ 0.72: the line explains about 72% of the variation in sleep
Sample questions: Merit
An agent wants to predict house prices in Hamilton. For 40 recent sales, price has r = 0.62 with land area and r = 0.81 with floor area. Find r² for each, compare them, and recommend which variable to use.
Hint
Square each r and compare the percentages of variation explained.
Answer
Land area r² = 0.3844 (about 38%); floor area r² = 0.6561 (about 66%). Floor area explains about 27 percentage points more of the variation in price, so it is the better single predictor, though about a third of the variation is still unexplained.
Step by step
- To compare how well two variables predict, compare their r² values: the share of the variation in price each line explains.
- Land area: r² = 0.62² = 0.3844, about 38%.
- Floor area: r² = 0.81² = 0.6561, about 66%.
- Difference: 0.6561 − 0.3844 = 0.2717, so floor area explains about 27 percentage points more.
- Classic mistake: comparing r values directly and saying floor area is only a little better (0.81 against 0.62). In terms of variation explained, the gap is much bigger.
- So floor area is the better single predictor of price for these sales.
- But even floor area leaves about 34% unexplained: location, age and condition matter too.
- Recommendation: use floor area, and look at the scatter plot and residuals to check that a straight line suits it.
Full working
- land: r² = 0.62² = 0.3844 ≈ 38%
- floor: r² = 0.81² = 0.6561 ≈ 66%
- 0.6561 − 0.3844 = 0.2717about 27 points more
- about 34% still unexplainedother variables
- Use floor area: it explains about 66% of the variation, against 38%
Across 25 Auckland suburbs, the number of cafés and the number of reported burglaries have r = 0.81. A resident says cafés attract burglars and wants fewer cafés. Evaluate the claim.
Hint
Look for a third variable that would make both numbers go up together.
Answer
The strong positive link does not show cause. Population (and how busy a suburb is) is a likely lurking variable: suburbs with more people and more shops have both more cafés and more burglaries. Comparing rates per 1000 residents would be a fairer test.
Step by step
- r = 0.81 is a strong positive linear relationship: suburbs with more cafés tend to have more burglaries.
- But a correlation only shows that the two go together. It does not show that one causes the other.
- Ask what else differs between suburbs. Bigger, busier suburbs have more people.
- More people means more customers, so more cafés. More people and more homes also means more chances for burglary.
- So population is a lurking variable: it pushes both numbers up, which can create the correlation by itself.
- Classic mistake: jumping from a strong r to a cause. A strong r can come entirely from a third variable.
- A fairer check: compare burglaries per 1000 residents with cafés per 1000 residents. If the link disappears, population explained it.
- Also, the data are observational, not an experiment, so cause cannot be shown either way.
- Conclusion: closing cafés is not supported by this evidence.
Full working
- r = 0.81strong positive association
- association is not cause
- population raises bothlurking variable
- compare per 1000 residentsfairer test
- Claim not supported: population likely explains the link
Sample questions: Excellence
At one Auckland school, 12 Year 13 students report daily phone hours (x) and NCEA credits so far (y). For all 12, r = −0.85 and the line is y = 87.6 − 6.47x. One student, with 8 hours and 20 credits, had been in hospital for most of the year. Without that student, r = −0.73 and y = 77.2 − 2.80x. A newspaper reports: "Every hour on your phone costs you 6.5 credits." Evaluate this headline.
Hint
Consider the influential point, what r² says, the sample, and whether the study can show cause.
Answer
The headline is not justified. The 6.5 comes from a slope pulled down by one unusual student; without him the slope is about 2.8 credits per hour and r² falls from about 0.72 to 0.53. The sample is 12 students at one school, self-reported, and observational, so it cannot show that phones cause fewer credits; other factors such as work, illness or motivation may explain both. At most: in this small group, more phone time was linked to fewer credits.
Step by step
- Start with the headline's number: 6.5 is the slope from all 12 students, rounded from 6.47.
- The student at 8 hours and 20 credits is far below the others and at the largest x. Points like that pull the line strongly.
- Without him, the slope is 2.80. So one student more than doubles the slope. The 6.5 is not a stable figure.
- Strength: with him r² = 0.85² ≈ 0.72; without him r² = 0.73² ≈ 0.53. The relationship is moderate to strong, but weaker than it first looked.
- His low credits have a known cause, hospital, that is not about phone use. So he should not drive the conclusion.
- Classic mistake: reading a slope as a cost per hour. A slope from observational data describes an association, not what would happen if a student changed their phone use.
- Lurking variables: part-time work, illness, motivation or home life could raise phone time and lower credits at the same time.
- Sample: 12 students from one school, so the results may not apply to other schools. Phone hours are self-reported, which is often inaccurate.
- A fair statement: in this small group, students who used their phones more tended to have fewer credits, about 2.8 fewer per hour once the hospital case is set aside.
- To test cause, you would need a much larger random sample and ideally an experiment, which raises its own ethical issues.
Full working
- slope 6.47 with the outlier, 2.80 withoutone point more than doubles it
- r² ≈ 0.72 with, ≈ 0.53 withoutweaker than it looks
- hospital stay is a separate causeoutlier should not drive it
- observational, lurking variablesno cause shown
- 12 students, one school, self-reportedsmall, not representative
- Headline not justified: at most an association of about 2.8 credits per hour in this group
A nursery measures the height (m) of a young tree each year: age 1: 1.0, age 2: 2.6, age 3: 3.9, age 4: 4.8, age 5: 5.4, age 6: 5.7. The least squares line is h = 0.62 + 0.94t, with r² = 0.94. A worker says: "r² is 0.94, so the line is an excellent model, and the tree will be 11.9 m tall at age 12." Calculate the residuals and evaluate the worker's statement.
Hint
Find actual − predicted for each age and look at the signs in order. Then think about whether a tree keeps growing at the same rate.
Answer
Residuals: −0.56, 0.10, 0.46, 0.42, 0.08, −0.56. They are negative at both ends and positive in the middle, an arch, so the growth is curved: it is slowing down. A high r² does not show this. The prediction of 11.9 m at age 12 is double the age range of the data and assumes growth stays at 0.94 m a year when it has already dropped to 0.3 m a year, so it is very likely far too high.
Step by step
- Predicted heights from h = 0.62 + 0.94t: 1.56, 2.50, 3.44, 4.38, 5.32, 6.26.
- Residuals, actual − predicted: 1.0 − 1.56 = −0.56, 2.6 − 2.50 = 0.10, 3.9 − 3.44 = 0.46, 4.8 − 4.38 = 0.42, 5.4 − 5.32 = 0.08, 5.7 − 6.26 = −0.56.
- In order the signs are −, +, +, +, +, −: negative at both ends and positive in the middle. That arch is a pattern, not random scatter.
- It means the data curve: the tree grows fast at first and then slows down. The straight line is the wrong shape.
- Look at the yearly growth: 1.6, 1.3, 0.9, 0.6, 0.3 m. It drops every year.
- Classic mistake: judging the model by r² alone. r² = 0.94 says the points are close to some straight line, not that a straight line is the right shape.
- Prediction: h = 0.62 + 0.94 × 12 = 0.62 + 11.28 = 11.9 m.
- Age 12 is twice the oldest age in the data, a big extrapolation.
- The line assumes 0.94 m of growth every year, but the tree grew only 0.3 m in its last year. The residual at age 6 is already −0.56, and it will get worse.
- So 11.9 m is very likely far too high. The tree may only gain a little more height.
- Better: fit a curved model that levels off, and only predict a short way past age 6. Also, one tree is a very small sample.
Full working
- predicted: 1.56, 2.50, 3.44, 4.38, 5.32, 6.26
- residuals: −0.56, 0.10, 0.46, 0.42, 0.08, −0.56actual − predicted
- −, +, +, +, +, − is an archgrowth is curved
- yearly growth 1.6, 1.3, 0.9, 0.6, 0.3 mslowing
- h(12) = 0.62 + 11.28 = 11.9 mfar extrapolation
- The statement is wrong: the residuals show a curve, so 11.9 m is very likely far too high
What to take away
- Numbers, residuals, context.
- Five points is not much evidence.
Report a mistake
More in AS 91581



Is your child on track?
Take the free placement test