Confidence intervals, claims, and why overlap fails
What this lesson covers
- A confidence interval is interpreted by naming the population, the variable and the parameter.
- Comparing groups uses an interval for the difference, not whether two intervals overlap.
From one sample to the population
- The true population value is unseen.
- An interval gives believable values.
- Form it, interpret it, then claim.
Forming the interval
- An invented council survey.
- Estimate ± margin of error.
- n = 625, 56% support
- MOE ≈ 1/√n = 1/√625
- = 1/25 = 0.04 = 4%exact
- 56 − 4 = 52
- 56 + 4 = 60
- 52% to 60%
Three things to name
- The population: everyone, not the sample.
- The variable: what was measured.
- The parameter: the proportion.
| Part | Here |
|---|---|
| Population | residents of the region |
| Variable | supports the bus route |
| Parameter | the proportion |
The interpretation
- I am fairly sure that the proportion...
- ...of all residents of the region...
- ...who support the route is 52% to 60%.
Then a separate claim
- The whole interval is above 50%.
- Claim: a majority support the route.
- Interpretation and claim, kept apart.
| Says | |
|---|---|
| Interpretation | where the proportion is |
| Claim | a majority support it |
| Because | all above 50% |
What "fairly sure" means
- Roughly a 95% confidence interval.
- About 95% of such intervals catch the truth.
- Sampling variation only, not bias.
Comparing two towns
- Two separate samples.
- Each has its own 1/√n.
- A: n = 400, 54% support
- B: n = 625, 46% support
- A: MOE ≈ 1/√400 = 1/20 = 5%
- B: MOE ≈ 1/√625 = 1/25 = 4%
- A: 54 − 5 = 49, 54 + 5 = 59
- B: 46 − 4 = 42, 46 + 4 = 50
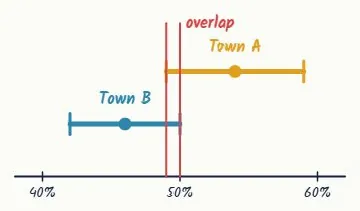
The intervals overlap. So what?
- Town A: 49% to 59%.
- Town B: 42% to 50%.
- Overlap reasoning: not accepted.
One interval for the difference
- Average MOE, times 1.5.
- Then difference ± margin.
- A: MOE 5%, B: MOE 4%
- average = (5 + 4)/2 = 4.5%
- MOE ≈ 1.5 × 4.5 = 6.75%two samples
- A − B = 54 − 46 = 8 points
- 8 − 6.75 = 1.25
- 8 + 6.75 = 14.75
- 1.25 to 14.75 points
Interpret the difference, then claim
- Name both populations and the variable.
- Town A higher by 1.25 to 14.75 points.
- All above zero: support is higher in A.
Overlap versus the difference interval
- Overlap: two intervals touch.
- Difference: one gap, clear of zero.
- Build the difference interval.
| Overlap | Difference CI | |
|---|---|---|
| Looks at | two intervals | one difference |
| Here | they overlap | 1.25 to 14.75 |
| Says | no difference? | Town A is higher |
| Accepted | no | yes |
Where is zero?
- All above or all below: claim a difference.
- Zero inside: no claim either way.
- That does not prove they are equal.
| Interval | Claim |
|---|---|
| All above zero | first group higher |
| All below zero | second group higher |
| Zero inside | no claim either way |
Where the marks are
- Achieved: form the interval.
- Merit: an interpretation or a claim.
- Excellence: difference, interpret, claim.
What to take away
- Form it, interpret it in context, then claim separately.
| Interval | estimate ± MOE |
| Interpret | population, variable |
| Parameter | the proportion |
| Then | a separate claim |
| Compare | difference interval |
| Never | overlap reasoning |
Your turn: four questions
- Pause here and answer each one.
- Pick the rule, then write the interval.
- Interpret, then claim.
| Given | Find | |
|---|---|---|
| 1 | n = 2500, 62% say yes | interpret |
| 2 | same poll: 48% v 40% | A − B |
| 3 | 625: 52%, 2500: 48% | a claim? |
| 4 | A 46%, B 53%, 625 each | differ? |
Show answer
1. MOE 1/√2500 = 2%; 60% to 64%. I am fairly sure the proportion of all residents of the region who support the pool is between 60% and 64%. 2. Same sample: 2/√2500 = 4%; difference 8: 4 to 12 points. All above zero, so site A is preferred. 3. Two samples: 1.5 × (4% + 2%)/2 = 4.5%; difference 4: −0.5 to 8.5 points. Zero is inside, so no claim of a difference between teenagers and adults. 4. Yes. The intervals 42% to 50% and 49% to 57% overlap, but the difference MOE is 1.5 × 4% = 6%, so the difference 7 gives 1 to 13 points, all above zero: support is higher in Town B.
The answers: questions 1 and 2
- 1. MOE ≈ 1/√2500 = 1/50 = 2%one proportion
- 62 − 2 = 60, 62 + 2 = 64
- 60% to 64% of all residents
- 2. MOE ≈ 2/√2500 = 2/50 = 4%same sample
- 48 − 40 = 8 pointsthe difference
- 8 − 4 = 4, 8 + 4 = 12
- 4 to 12 points: site Aall above zero
The answers: questions 3 and 4
- 3. 1/√625 = 4%, 1/√2500 = 2%two samples
- MOE ≈ 1.5 × 3 = 4.5%average (4 + 2)/2 = 3
- 52 − 48 = 4 pointsthe difference
- 4 − 4.5 = −0.5, 4 + 4.5 = 8.5
- zero inside: no claim
- 4. 1/√625 = 4% for each town
- MOE ≈ 1.5 × 4 = 6%two samples
- 53 − 46 = 7 pointsB − A
- 7 − 6 = 1, 7 + 6 = 13all above 0: B higher
Is your child on track?
Take the free placement test