Uniform and triangular distributions, and judging a model
What this lesson covers
- Continuous uniform and triangular probabilities are areas of rectangles and triangles.
- A model is judged by comparing its probabilities with the data's relative frequencies.
Models with hard limits
- Some values cannot go below a or above b.
- Uniform and triangular: both in the booklet.
- A probability is an area. Total area 1.
Uniform: a flat pdf
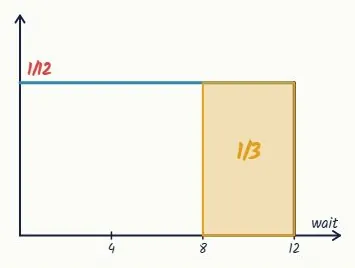
- Every wait from 0 to 12 equally likely.
- Height 1/(b − a) = 1/12.
- More than 8 minutes: a rectangle.
The working, and the assumption
- Width × height.
- Assumes a random arrival.
- X ~ U(0, 12)
- height = 1/(12 − 0) = 1/12
- P(X > 8) = width × height
- = (12 − 8) × 1/12
- = 4/12 = 1/3 = 0.3333
Triangular: a = 2, c = 4, b = 10
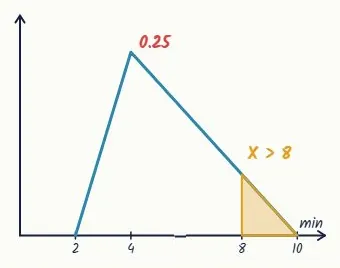
- Lowest 2, most likely 4, highest 10.
- Peak height 0.25 at c = 4.
- Over 8 minutes: a small triangle.
The tail: ½ × base × height
- Peak 2/(b − a).
- Then ½ × base × height.
- a = 2, c = 4, b = 10
- peak = 2/(10 − 2) = 0.25
- f(8) = (10 − 8)/(10 − 4) × 0.25
- = 2/6 × 1/4 = 1/12
- P(X > 8) = ½ × base × height
- = ½ × 2 × 1/12
- = 1/12 = 0.0833
A middle area: 1 minus the tails
- 1 minus both tails.
- The left tail: a triangle.
- f(3) = (3 − 2)/(4 − 2) × 0.25
- = 1/2 × 0.25 = 0.125
- P(X < 3) = ½ × 1 × 0.125
- = 0.0625
- P(X > 8) = 0.0833from before
- P(3 < X < 8) = 1 − 0.0625 − 0.0833
- = 0.8542
Choosing a, b and c
- a and b: the plausible limits.
- c: the most likely value, the peak.
- Nothing more likely? Uniform.
| Parameter | Choose it as |
|---|---|
| a | lowest plausible value |
| b | highest plausible value |
| c | most likely value |
| Uniform | no value more likely |
The model against 80 orders
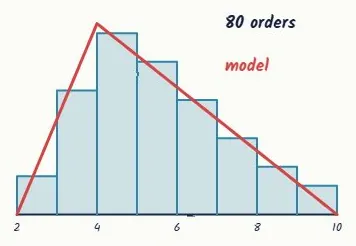
- No order under 2 or over 10 minutes.
- Tallest bar: 4 to 5 minutes.
- Judge it with numbers, not by eye.
Relative frequency against the model
- Count ÷ total.
- Then compare.
- X > 8: 8/80 = 0.1model 0.0833
- X < 3: 4/80 = 0.05model 0.0625
- 4 to 5: 19/80 = 0.2375
- model f(5) = 5/6 × 0.25 = 5/24
- model: ½(1/4 + 5/24) × 1 = 11/48
- = 0.2292data 0.2375
Common slips with triangles
- Triangle peak: 2/(b − a), not 1/(b − a).
- A triangle needs the half.
- A count is not a probability.
| Wrong | Right | |
|---|---|---|
| Triangle height | 1/(b − a) | 2/(b − a) |
| Triangle area | base × height | ½ × base × height |
| From a histogram | 8 orders | 8/80 = 0.1 |
| Model | not named | a = 2, c = 4, b = 10 |
Changing a parameter: b = 11
- Raise b to 11.
- Over 8 jumps past 0.1.
- b = 11: peak = 2/(11 − 2) = 2/9
- f(8) = (11 − 8)/(11 − 4) × 2/9
- = 3/7 × 2/9 = 2/21
- P(X > 8) = ½ × 3 × 2/21 = 1/7
- = 0.1429data 0.1
- f(3) = 1/2 × 2/9 = 1/9
- P(X < 3) = ½ × 1 × 1/9 = 0.0556
Changing a parameter: c = 5
- Or move c to 5.
- Fix one tail, check the rest.
- c = 5: peak = 2/(10 − 2) = 0.25
- f(8) = (10 − 8)/(10 − 5) × 0.25
- = 2/5 × 0.25 = 0.1
- P(X > 8) = ½ × 2 × 0.1 = 0.1matches the data
- f(3) = (3 − 2)/(5 − 2) × 0.25
- = 1/3 × 0.25 = 1/12
- P(X < 3) = ½ × 1 × 1/12 = 0.0417
Where the marks are
- Achieved: sketch, and a probability as an area.
- Merit: justify a, b and c.
- Excellence: judge the fit, and changes.
What to take away
- Sketch it, find the area, then check it against data.
| Uniform height | 1/(b − a) |
| Triangle peak | 2/(b − a) |
| Probability | an area |
| Middle area | 1 − the two tails |
| a, b and c | from data and context |
| Judge a model | relative frequencies |
Your turn: four questions
- Pause here and answer each one.
- Sketch each pdf and mark its height.
- Questions 2 and 3 share a model.
| Given | Find | |
|---|---|---|
| 1 | X ~ U(10, 30) | P(X > 25) |
| 2 | a = 0, c = 6, b = 10 | P(X < 3) |
| 3 | the same model | P(X > 8) |
| 4 | 14 of 100 over 8 | judge Q3 |
Show answer
1. Height 1/20; 5 × 1/20 = 0.25. 2. Peak 0.2, height at 3 is 0.1; ½ × 3 × 0.1 = 0.15. 3. Height at 8 is 0.1; ½ × 2 × 0.1 = 0.1. 4. Data 14/100 = 0.14 against the model 0.1: the model is light in the upper tail, so a larger c or b would fit better (c = 7 gives 0.1333).
The answers: questions 1 and 2
- 1. X ~ U(10, 30): height 1/20
- P(X > 25) = (30 − 25) × 1/20
- = 5/20 = 0.25
- 2. a = 0, c = 6, b = 10
- peak = 2/(10 − 0) = 0.2
- f(3) = (3 − 0)/(6 − 0) × 0.2
- = 1/2 × 0.2 = 0.1
- P(X < 3) = ½ × 3 × 0.1 = 0.15
The answers: questions 3 and 4
- a = 0, c = 6, b = 10, peak 0.2
- 3. f(8) = (10 − 8)/(10 − 6) × 0.2
- = 1/2 × 0.2 = 0.1
- P(X > 8) = ½ × 2 × 0.1 = 0.1
- 4. data: 14/100 = 0.14
- 0.14 > 0.1model light in upper tail
- c = 7: f(8) = 2/3 × 0.2 = 0.1333
- P(X > 8) = ½ × 2 × 0.1333 = 0.1333
Is your child on track?
Take the free placement test