Reading a dot plot properly
What this lesson covers
- Interpreting a data visualisation includes describing its variables and their units, the context for the data, and the visualisation’s key features: its shape (e.g. the number of peaks) its middle group(s) (where the middle of the data lies) its spread (how spread the data is from the minimum (lowest) value to the maximum (highest) value).
Every dot is a person
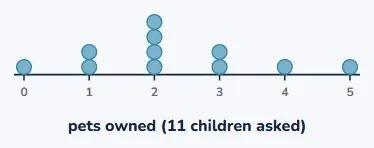
- Eleven children were asked how many pets they have.
- Each dot is one child.
- Remember that and the rest gets much easier.
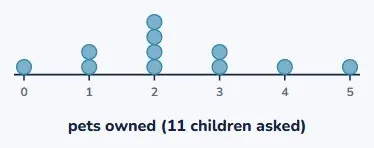
Two things are being counted
- How tall a stack is counts PEOPLE.
- Where a stack sits counts PETS.
- Two different things, in one picture.
| this bit of the picture | counts |
|---|---|
| one dot | one person |
| how tall a stack is | how many people |
| where a stack sits | how many pets |
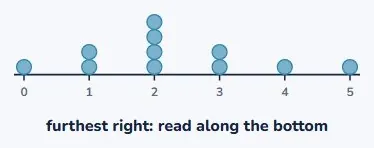
Question one: how many pets?
- "How many pets does the person with the most pets have?"
- Find the dot furthest to the right.
- It sits above 5. So the answer is 5 pets.
Question two: which is commonest?
- "What is the commonest number of pets?"
- Find the TALLEST stack. That is the one at 2.
- The answer is 2 pets. Not 4.
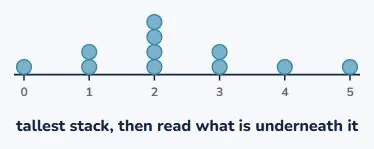
Why the answer is not 4
- The tallest stack has 4 dots in it.
- But 4 is how many PEOPLE, not how many pets.
- The question asked about pets. So read underneath.
| if you answer | you have said | but the question asked about |
|---|---|---|
| 4 | 4 people | pets |
| 2 | 2 pets | pets (correct) |
So ask yourself first
- Before you answer: is this about pets, or about people?
- Pets: read along the bottom.
- People: count the dots.
| question | about | so |
|---|---|---|
| how many pets does the person with the most have? | pets | read along the bottom |
| what is the commonest number of pets? | pets | find the tallest stack, read below it |
| how many people have 2 pets? | people | count the dots in that stack |
Describing the shape
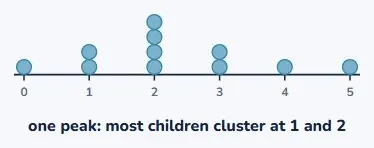
- Step back and look at the outline.
- Is there one lump, or two, or none?
- This one has a single peak, at 2 pets.
Where it starts and where it stops
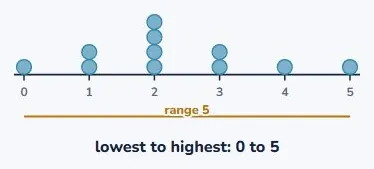
- The lowest answer was 0 pets. The highest was 5.
- So the answers spread from 0 to 5.
- That is 5 apart, end to end.
Say what it is actually about
- Never just say "the answer is 2".
- Say "2 pets, that is the commonest in this class".
- A number with no context has not told anyone anything.
| not this | this |
|---|---|
| "5" | "the most any child had was 5 pets" |
| "4" | "4 children have 2 pets each" |
| "0 to 5" | "answers ranged from 0 to 5 pets" |
Your turn
- How many children have exactly 3 pets?
- What is the fewest pets anybody has?
- How many children were asked altogether?
Show answer
2 children: count the dots in the stack above 3, so this one is about PEOPLE. 0 pets: the leftmost dot, so this one is about PETS. 11 children: count every dot on the whole plot. Make them say "people" or "pets" before each answer; getting the right number for the wrong reason is the thing that catches up with them later.
Reading the picture
- Every dot is one person.
- Ask whether the question is about people or about the thing.
- Then answer with the units, not just a number.
| idea | what to remember |
|---|---|
| one dot | one person |
| stack height | how many people |
| stack position | how many pets |
| "commonest" | tallest stack, read underneath it |
| shape | how many lumps, and where |
| spread | lowest to highest |
| every answer | say the units and who was asked |
Is your child on track?
Take the free placement test