Drawing graphs that tell the truth
What this lesson covers
- Data visualisations are representations of all available values for a variable showing the frequency for each value.
- Data visualisations show patterns, trends, and variations.
- Numerical data can be visualised with dot plots or bar graphs.
- A good data visualisation includes, where appropriate: a title that gives the purpose of the visualisation variable(s) (e.g. labelled on the axis) the group the data is from units for a numerical variable values or categories frequency, with the scale starting at 0.
Start with a list of answers
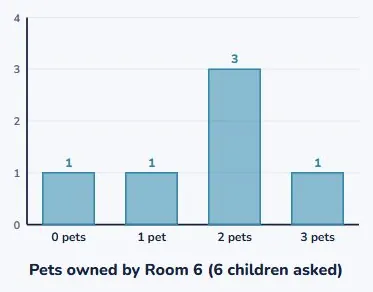
- You asked six people how many pets they have.
- This is what they said.
- It is hard to see anything in a list.
| person | pets |
|---|---|
| Aria | 2 |
| Tane | 0 |
| Sam | 2 |
| Mia | 3 |
| Leo | 2 |
| Ana | 1 |
A graph shows how often each answer came up
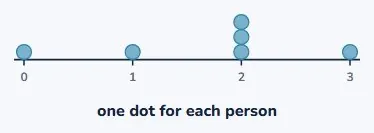
- Write down the possible answers: 0, 1, 2, 3.
- Then stack a dot for every person who said it.
- That is the whole method.
Now you can see it
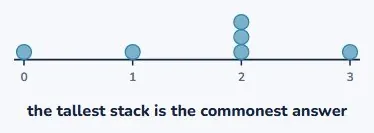
- The tall stack at 2 jumps out immediately.
- Most people have 2 pets.
- The list had that in it. The picture shows it.
Or count the stacks into bars
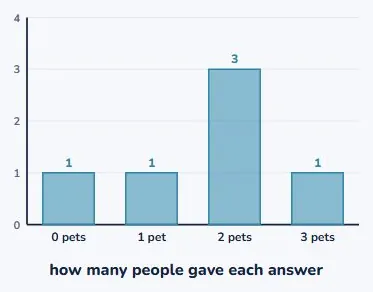
- A bar graph draws the height instead of the dots.
- Same data. Tidier when there are lots of people.
- A dot plot is better when you want to see everybody.
Which one should you draw?
- Few people, and you care about individuals? Dot plot.
- Lots of people? Bar graph.
- Neither is wrong. They do different jobs.
| picture | what it shows | best when |
|---|---|---|
| dot plot | one dot per person | you want to see everybody |
| bar graph | a bar per total | there are lots of people |
Careful: this graph is lying
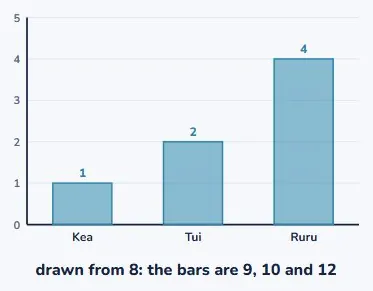
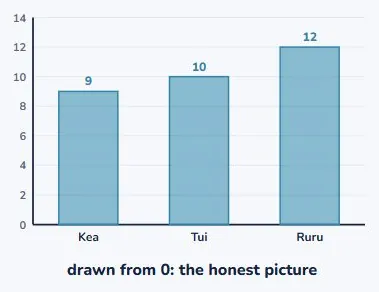
- Three teams scored 9, 10 and 12 goals.
- This chart starts at 8, not 0.
- The last bar looks about four times the first.
The same numbers, drawn from zero
- Nothing about the data changed.
- Now you can see 12 is only a bit more than 9.
- Always start the scale at 0. Always.
What a stranger needs to know
- Someone walks past your graph. They know nothing.
- They cannot ask you what it means.
- So the graph has to answer their questions by itself.
| put this on it | because they will wonder |
|---|---|
| a title | what is this about? |
| label on each axis | what was measured? |
| who the data is from | who did you ask? |
| units | how many of what? |
| the scale starts at 0 | can I trust the sizes? |
A finished graph
- Title: "Pets owned by Room 6".
- Across the bottom: number of pets.
- Up the side: how many children, starting at 0.
Your turn
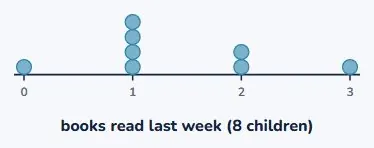
- Eight children: 1, 2, 1, 0, 3, 1, 2, 1 books read.
- Which answer is commonest?
- Name two things the graph must have on it.
Show answer
1 book is commonest: four children said it, so that stack is tallest. Any two of: a title, a label on each axis, who was asked, and a scale starting at 0. If anyone answers "4" to the second question they have given the height of the stack rather than the answer it sits above, which is exactly the confusion the next lesson is about.
Drawing the picture
- A graph shows how often each answer came up.
- Start the scale at 0 or the picture lies.
- Label it so a stranger needs no help.
| idea | what to remember |
|---|---|
| what a graph shows | how often each answer came up |
| a dot plot | one dot per person |
| a bar graph | one bar per answer, height = how many |
| the scale | always starts at 0 |
| a title | what it is about |
| axis labels | what was measured, and how many |
Is your child on track?
Take the free placement test