 Vertex Learn
Traits, inheritance and variation in living things
What this lesson covers
- What a trait is
- Traits that sort into groups and traits that vary smoothly
- How surroundings can change the way a trait shows
- Young inherit traits from their parents
- Variation: no two individuals are exactly the same
- Why some variations help living things survive
- Collecting trait data and showing it in a histogram
What is a trait?
- A trait is a feature of a living thing that you can see or measure.
- The colour of a cat's fur, the size of a pōhutukawa leaf and the shape of a bird's beak are all traits.
- A kiwi's long, thin beak is a trait that lets it probe deep into soil for worms.
Groups or a range
- Some traits fall into clear groups with nothing in between. A sweet pea flower might be pink, white or purple.
- Other traits spread across a smooth range of values. Height, leaf length and mass can be any value between the smallest and the largest.
- To show a trait that falls into groups, use a bar graph with a gap between the bars. To show a trait with a range, sort the values into equal intervals and draw a histogram, where the bars touch.
| Trait | Clear groups or a range? |
|---|---|
| Flower colour of sweet peas | Clear groups |
| Whether a sheep has horns | Clear groups |
| Height of kōwhai trees | A range |
| Length of pōhutukawa leaves | A range |
Try it: groups or a range?
Passing traits on
- Offspring are the young of a living thing: puppies, chicks, lambs, or seedlings that grow from seeds.
- Offspring inherit, or receive, many traits from their parents.
- That is why pōhutukawa seeds grow into pōhutukawa trees and never into kōwhai, and why the lambs of black-faced sheep usually have black faces too.
Alike, but not the same
- A species is one kind of living thing whose members can breed together, such as tūī or house cats.
- Offspring look like their parents and like each other, but they are never exact copies. Kittens in one litter can have different patches and patterns.
- Variation means the differences between individuals of the same species. Garden snails, for example, can have shells with different colours and bands.
Surroundings shape traits too
- The environment is everything around a living thing: the weather, the soil, food, light and water.
- The environment can change how a trait turns out. Trees on a coast blasted by strong wind from one side grow bent over, like the famous leaning trees at Slope Point in Southland.
- The same kind of tree in a sheltered valley grows straight.
- So a trait depends on what is inherited and on the surroundings.
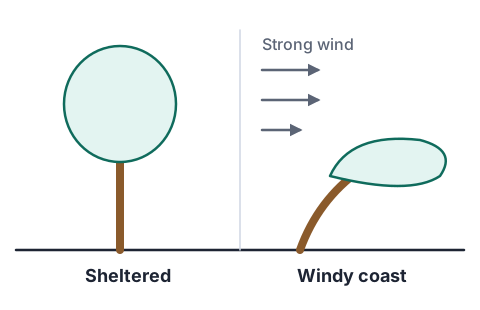
Try it: inherited or shaped by surroundings?
Some differences help living things survive
- Some variations make it easier for a living thing to survive and have young.
- Picture a field of dry, brown grass with green and brown grasshoppers in it. Birds spot the green ones more easily and eat more of them.
- More brown grasshoppers survive to have young, and those young inherit the brown colour, so over many years more of the grasshoppers there are brown.
Collecting trait data fairly
- To study variation, measure the same trait on many individuals of one species, in the same way every time.
- For leaves, choose them from all around the plant, not just the biggest ones, and measure from the tip to where the stalk starts.
- Pooling means putting everyone's results together. A pooled class set is bigger, so the pattern it shows is easier to trust.
Pōhutukawa leaves in a histogram
- Room 6 measured 40 leaves from one pōhutukawa tree and pooled their results into groups. What does the pattern show?
| Leaf length (cm) | Number of leaves |
|---|---|
| 4.0 to 4.9 | 3 |
| 5.0 to 5.9 | 7 |
| 6.0 to 6.9 | 13 |
| 7.0 to 7.9 | 10 |
| 8.0 to 8.9 | 5 |
| 9.0 to 9.9 | 2 |
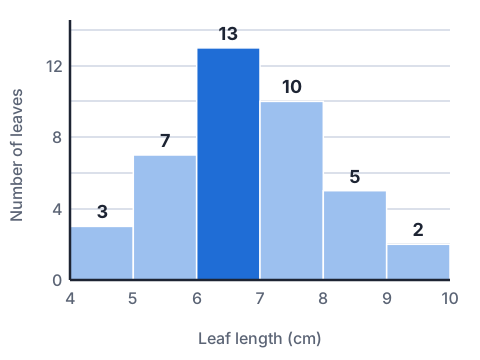
- 3 + 7 + 13 + 10 + 5 + 2 = 40 leavescheck the total
- The tallest bar is 6.0 to 6.9 cm, with 13 leavesthe most common group
- The lengths run from about 4 cm to 10 cmthe range
- Most leaves are in the middle and few are very short or very longthe shape
- Leaf length varies across a smooth range, with most leaves 6.0 to 6.9 cm long
Common mistakes
- Brothers and sisters from the same parents are exactly the same.Offspring are similar to each other but never identical; there is always some variation.
- Every trait comes only from the parents.The environment matters too: a tree bent by wind or a plant grown in shade shows how surroundings change a trait.
- A histogram has gaps between the bars, like a bar graph.In a histogram the bars touch, because the groups are a smooth range of values with no gaps between them.
- Measuring the five biggest leaves on a tree shows how leaf size varies.Pick leaves from all around the plant, or the results will be too big and will hide the variation.
Measure leaf variation in your garden
You need: a ruler marked in mm, paper and a pencil, a plant with plenty of leaves of one kind, such as a hedge
- With an adult, choose one plant and pick 20 leaves from all around it, high and low, sunny side and shady side.
- Measure each leaf from its tip to where the stalk starts, to the nearest millimetre, and write the lengths down.
- Sort the lengths into groups of 1 cm, for example 4.0 to 4.9 cm, and count how many leaves are in each group.
- Draw a histogram with the groups along the bottom and the number of leaves up the side, with the bars touching.
- Look for this: most leaves sit in the middle groups, with only a few very short or very long ones.
Safety: Ask an adult to choose the plant, because some garden plants are poisonous or have sap that burns the skin, and wash your hands afterwards.
Your turn
Which of these is a trait: the colour of a dog's coat, the dog's name, or the dog's favourite toy?
Does the length of a cat's tail fall into clear groups or a range?
Two kōwhai seedlings come from the same tree. One grows tall in the sun and one stays small in deep shade. What caused the difference?
White and brown mice live in a dark, brown forest. Owls hunt them by sight. Which colour will probably become more common, and why?
In Room 6's histogram, how many leaves were 8.0 cm or longer?
Show answer
1. The colour of its coat, a feature of its body you can see; a name and a favourite toy are not part of the dog. 2. A range, because tail length can be any value. 3. The environment: the amount of light changed how the trait turned out. 4. Brown, because owls see white mice more easily, so more brown mice survive and pass on their colour. 5. 5 + 2 = 7 leaves.
Natural Selection
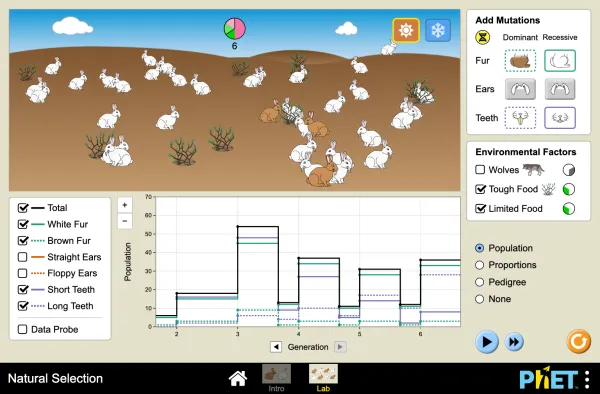
Full screen · PhET Interactive Simulations, University of Colorado Boulder, CC BY 4.0
Recap
- A trait is a feature you can see or measure.
- Some traits fall into clear groups; others vary across a smooth range.
- Offspring inherit traits from their parents but are never exact copies.
- Variation is the differences between individuals of one species.
- The environment can change how a trait shows, and some variations help survival.
- Pooled measurements in a histogram show how a trait varies.
The maths behind it
Report a mistake
How is Year 6 maths going?
See the Year 6 maths guide