The mean, the range and time-series data
What this lesson covers
- Bivariate data includes time-series data with two numerical values, one time-based.
- The answers to a statistical investigative question will vary for different subjects.
- The mean (average) measures the centre of numerical data. The mean is the sum of all the values divided by the total number of values.
- The range measures the spread of numerical data. The range is the difference between the highest and lowest values.
A question with no single answer
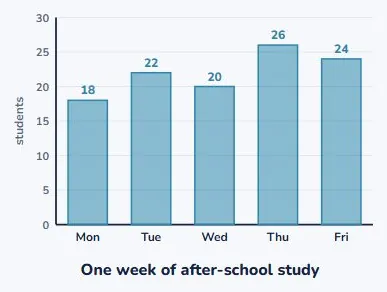
- "How many students come to after-school study?"
- Monday: 18. Thursday: 26.
- There is no one number. So what do you say?
The variation is the finding
- A statistical question gives different answers each time.
- That is not a fault in the data.
- It is what the data is telling you.
| Question | Answers |
|---|---|
| How tall is a Year 6 student? | all different |
| How long is your trip to school? | all different |
| What is 7 × 8? | 56, every time |
So we describe it with two numbers
- One for the middle of the data.
- One for how spread out it is.
- The mean, and the range.
| Number | What it measures |
|---|---|
| Mean | the centre |
| Range | the spread |
The mean
- Add up every value.
- Divide by how many values there are.
- That is the whole rule.
| Step | Working | Result |
|---|---|---|
| Add every value | 18 + 22 + 20 + 26 + 24 | 110 |
| Count the values | Mon to Fri | 5 |
| Divide | 110 ÷ 5 | 22 |
The mean of our week
- 18 + 22 + 20 + 26 + 24 = 110.
- Five days, so divide by 5.
- 110 ÷ 5 = 22 students.
What the mean means
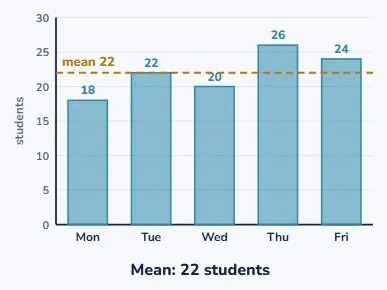
- The dashed line is the mean.
- Some bars poke above it, some fall short.
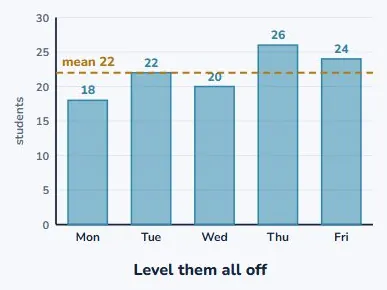
- Level them all off and every day would be 22.
The mean need not be one of the values
- Here it happens to be: Tuesday was 22.
- Usually it is not.
- The mean of 3 and 4 is 3.5, and that is a fine answer.
| Values | Mean |
|---|---|
| 3 and 4 | 3.5 |
| 1, 2 and 4 | 2.33… |
| 18, 22, 20, 26, 24 | 22 |
The range
- Find the highest value and the lowest.
- Subtract.
- That single number is the spread.
| Step | Which day | Value |
|---|---|---|
| Highest value | Thursday | 26 |
| Lowest value | Monday | 18 |
| Subtract | 26 − 18 | 8 |
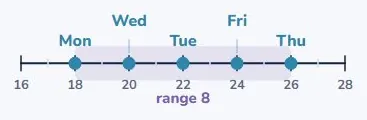
The range of our week
- Highest: Thursday, 26. Lowest: Monday, 18.
- 26 − 18 = 8.
- The five days sit within a band 8 students wide.
The range is one number
- Not "18 to 26"; that is the two ends.
- The range is the difference: 8.
- A small range means the values are close together.
| Said | Is it the range? |
|---|---|
| "18 to 26" | no, that is the two values |
| "8" | yes |
| "8 students" | yes, with its unit |
Why you need both
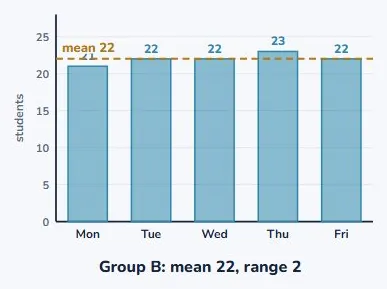
- Group B also has a mean of exactly 22.
- But its range is 2, not 8.
- Same middle, completely different week.
- The mean alone cannot tell them apart.
| Group | Values | Mean | Range |
|---|---|---|---|
| Group A | 18, 22, 20, 26, 24 | 22 | 8 |
| Group B | 21, 22, 22, 23, 22 | 22 | 2 |
Group B, drawn
- Nearly flat. Every day close to 22.
- Same dashed mean line as before.
- The bars are what changed, not the average.
One odd value
- Suppose Thursday had been 60 instead of 26.
- The mean moves from 22 to 28.8.
- The range jumps from 8 to 42.
- The range is built from two values, so it moves further.
| Week | Values | Mean | Range |
|---|---|---|---|
| Normal week | 18, 22, 20, 26, 24 | 22 | 8 |
| Odd Thursday | 18, 22, 20, 60, 24 | 28.8 | 42 |
Two values for each subject
- One measurement each is not bivariate.
- Two measurements each is.
- Height and arm span, for every student.
| Data | Example | Kind |
|---|---|---|
| One value each | height of each student | not bivariate |
| Two values each | height and arm span | bivariate |
| Two, one is time | mass of carrots each day | a time series |
When one value is time
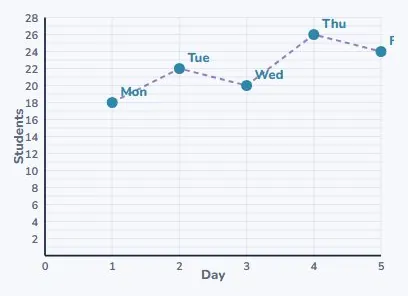
- Then it is a time series.
- Time along the bottom, the measurement up the side.
- Join the points and you can see the week.
Collecting a time series
- Measure the same thing, the same way, at set times.
- Weigh a bag of carrots sold as a kilogram, once a day.
- It will not be 1000 g every day.
| Day | Mass |
|---|---|
| Day 1 | 1000 g |
| Day 2 | 985 g |
| Day 3 | 1010 g |
| Day 4 | 995 g |
| Day 5 | 1000 g |
The carrots, summarised
- Sum: 4990 g over 5 days.
- 4990 ÷ 5 = 998 g. Just under the kilogram.
- Range: 1010 − 985 = 25 g.
| Measure | Working | Result |
|---|---|---|
| Mean | 4990 ÷ 5 | 998 g |
| Range | 1010 − 985 | 25 g |
Your turn
- 1. Find the mean of 4, 8, 6, 2.
- 2. Find the range of 4, 8, 6, 2.
- 3. Two sets both have mean 10. Must they be the same?
- 4. Is "the temperature at noon each day" a time series?
Show answer
1. 4 + 8 + 6 + 2 = 20, and 20 ÷ 4 = 5. 2. 8 − 2 = 6. 3. No, the mean describes the middle only, and two sets with the same mean can have completely different spreads, as Group A and Group B did. 4. Yes: two numerical values for each reading, and one of them is time.
What to take away
- A statistical question has answers that vary. That is the data.
- Mean: add them all, divide by how many.
- Range: highest take lowest. One number.
- Neither is enough on its own.
Is your child on track?
Take the free placement test