Reading and drawing data graphs
What this lesson covers
- Time-series data can be visualised with a time-series or line graph formed on a coordinate plane, with the x-axis representing time and the y-axis the second variable.
- Interpreting a data visualisation includes describing its variables and their units, the context for the data, and the visualisation's key features: its shape (e.g. the number of peaks) its middle group(s) (where the middle of the data lies) its spread (how spread the data is from the minimum (lowest) value to the maximum (highest) value).
Two weeks, identical numbers
- Both weeks have a mean of exactly 21°C.
- Both have a range of exactly 6°C.
- So they are the same week. Are they?
| Week | Daily maximum, °C | Mean | Range |
|---|---|---|---|
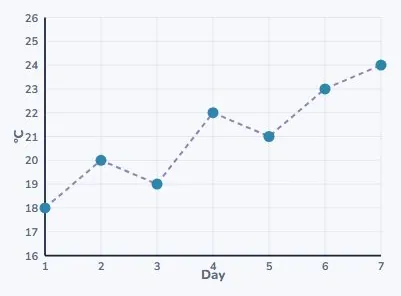
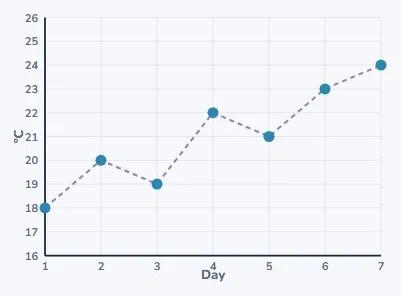
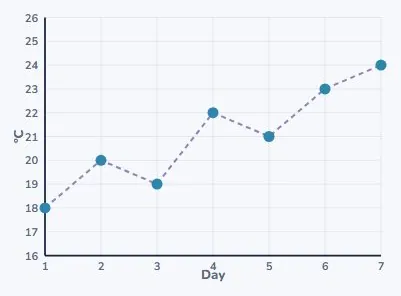
| Week 1 | 18, 20, 19, 22, 21, 23, 24 | 21°C | 6°C |
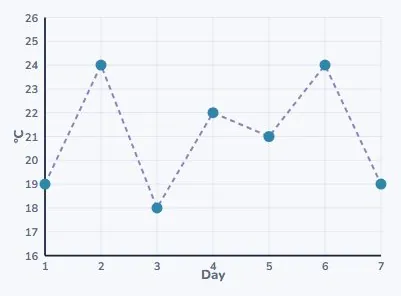
| Week 2 | 19, 24, 18, 22, 21, 24, 19 | 21°C | 6°C |
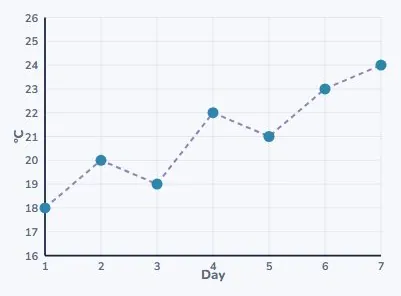
Week 1, drawn
- It climbs. 18 on Monday, 24 by Sunday.
- Two small dips on the way up.
- A week that warmed up.
Week 2, drawn
- Up, down, up, down.
- It finishes at 19, where it started.
- Nothing like week 1.
So the numbers were not enough
- Same mean. Same range. Different week.
- The summary tells you the middle and the spread.
- The picture tells you the shape.
| Tells you | Mean & range | Graph |
|---|---|---|
| The middle | yes | yes |
| The spread | yes | yes |
| The shape | no | yes |
| Whether it trended | no | yes |
Building a time-series graph
- Time always goes along the bottom.
- The thing you measured goes up the side.
- Label both, with their units.
Plot, then join
- One point for each day.
- Then join neighbours with straight lines.
- The line is a guide for the eye, not measured data.
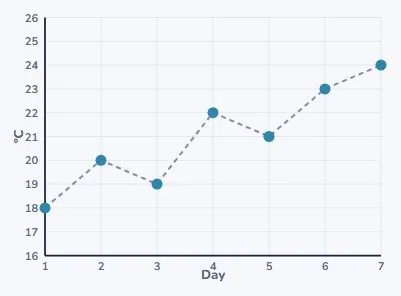
Does it show a trend?
- A trend is the overall direction.
- Week 1 starts at 18 and ends at 24.
- Up 6°C across the week: yes, a rising trend.
And week 2?
- It moves plenty: 18 up to 24 and back.
- But it starts at 19 and ends at 19.
- Movement without direction. No trend.
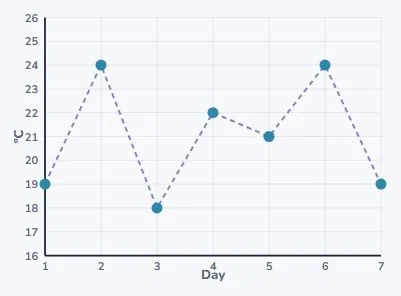
A trend is not the last two points
- Week 2 rose from day 5 to day 6.
- That is not a trend, it is one day.
- Look at the whole graph, end to end.
| Looking at | Week 2 says |
|---|---|
| Days 5 to 6 | rising fast |
| Days 6 to 7 | falling fast |
| The whole week | going nowhere |
Choosing the right picture
- Data that changes over time: a line graph.
- Data in separate categories: a bar chart.
- The data decides, not what looks nicer.
| Your data | Use | Example |
|---|---|---|
| Changes over time | line or time-series graph | temperature each day |
| Separate categories | bar chart | how students travel |
| Parts of one whole | bar chart is still clearest | at Year 6 |
How the class gets to school
- Five categories, 35 students.
- Separate bars, with gaps between them.
- The gaps say these are separate groups.
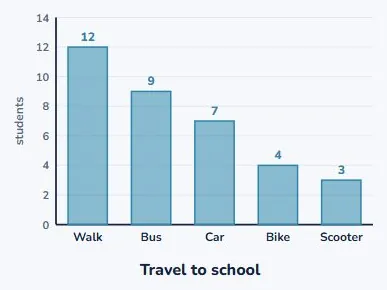
Why not join those up?
- A line between "walk" and "bus" would mean something.
- It would mean there are values in between.
- There are not. So no line.
| Between two points | Is there anything there? |
|---|---|
| Day 3 and day 4 | yes, the hours in between |
| Walk and bus | no, nothing is half of either |
Interpreting a graph
- Name the variables and their units.
- Give the context: whose data, when, where.
- Then describe its shape, middle and spread.
| Say | For week 1 |
|---|---|
| The variables | day, and maximum temperature |
| Their units | days; degrees Celsius |
| The context | Auckland, one week in March |
| The shape | rising, with two small dips |
| The middle | most days near 21°C |
Variables and units first
- The variables: the day, and the maximum temperature.
- The units: days, and degrees Celsius.
- "It goes up to 24" means nothing without the unit.
| Axis | Variable | Unit |
|---|---|---|
| Across | day of the week | days 1–7 |
| Up | maximum temperature | °C |
Then the context
- Whose data is it? Measured where, and when?
- Auckland, one week in March.
- The same graph from July would say something else.
| Question | Answer |
|---|---|
| What was measured? | the daily maximum |
| Where? | Auckland |
| When? | one week in March |
| How often? | once a day |
Shape: count the peaks
- The travel chart has one peak: walking.
- Then it falls away steadily to scooter.
- One peak, falling to the right.
| Feature | Travel chart |
|---|---|
| Peaks | one: walking |
| Then | falls away steadily |
| Smallest group | scooter, 3 students |
| Spread | from 3 up to 12 students |
Middle and spread
- The middle: where most of the data sits.
- Week 1 has most days near 21°C.
- The spread runs from the lowest to the highest: 18 to 24.
The two numbers, from the graph
- Add the seven readings: 147.
- 147 ÷ 7 = 21°C (the mean).
- 24 − 18 = 6°C (the range).
- Temperature is measured, so keep the unit on both.
| Measure | Working | Result |
|---|---|---|
| Mean | 147 ÷ 7 | 21°C |
| Range | 24 − 18 | 6°C |
Look at where the axis starts
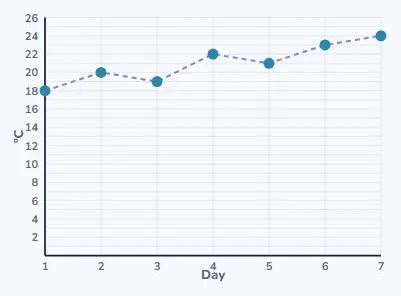
- The same week 1, now drawn from 0 instead of 16.
- The same rise, and it looks almost flat.
- Neither graph is lying.
- So check the axis before you believe the slope.
Your turn
- 1. Line graph or bar chart: favourite fruit in your class?
- 2. Line graph or bar chart: your height each birthday?
- 3. A graph starts at 5 and ends at 5. Any trend?
- 4. Find the mean of 10, 12, 11, 15, 12.
Show answer
1. Bar chart: the fruits are separate categories with no order. 2. Line graph: it is a time series, one measurement per year. 3. No trend; it may have moved about in between, but there is no overall direction. 4. 10 + 12 + 11 + 15 + 12 = 60, and 60 ÷ 5 = 12.
What to take away
- Same mean and range can still be different data.
- Time on the bottom, measurement up the side, both labelled.
- A trend is the whole graph, not the last two points.
- Always read the axis before you read the shape.
Is your child on track?
Take the free placement test