Ecosystems: biotic and abiotic factors, quadrats and transects
What this lesson covers
- Biotic and abiotic factors in an ecosystem
- Why different physical conditions support different organisms
- Why similar conditions in different places hold similar kinds of organisms
- Sampling with quadrats and transects, and measuring abiotic factors
- Using recorded data to spot patterns and changes over time
- Mātauranga Māori as knowledge built from long-term observation
- Ngā tohu o te taiao as signs of the seasons and of ecosystem health
Living and non-living parts
- An ecosystem is all the organisms in an area together with their physical surroundings, and the way they affect each other.
- Biotic factors are the living parts, and also things that were recently alive, such as a fallen log or leaf litter, because they still feed and shelter other organisms.
- Abiotic factors are the non-living physical and chemical conditions, such as air, water, temperature, light and the minerals in soil.
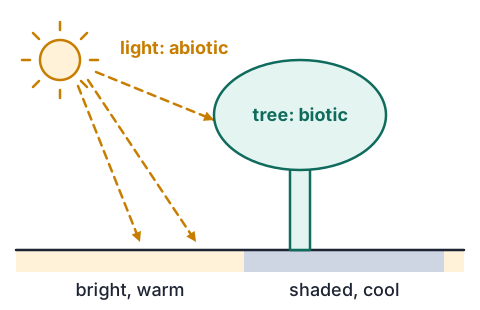
- The two kinds act on each other: shade from a tree (biotic) lowers the light and temperature (abiotic) on the ground beneath it.
| Biotic | Abiotic |
|---|---|
| kauri trees and ferns | light reaching the forest floor |
| kererū eating and spreading berries | rainfall and humidity |
| fungi and bacteria breaking down leaf litter | temperature |
| a rotting log | soil minerals, pH and moisture |
| predators such as stoats | wind and slope |
Different conditions, different life
- Each kind of organism can only survive within a range of conditions, set by what its body can cope with.
- Hokitika on the West Coast gets about 2,800 mm of rain a year and supports thick, wet rainforest full of ferns, mosses and epiphytes.
- Alexandra in Central Otago gets under 400 mm, with hot summers and frosty winters, and supports tussock, thyme and hardy shrubs instead.
- Even within one bush walk in the Waitākere Ranges, damp shaded gullies hold different plants from sunny, dry ridges a few hundred metres away.
Similar conditions, similar organisms
- Places with similar conditions tend to hold similar kinds of organisms, even if they are on different sides of the world.
- That is because the same features help organisms survive the same problems, such as a thick, water-storing stem in a desert.
- So if you know the conditions of a place, you can predict what kinds of organisms are likely there, and the reverse.
| Organism | Conditions where it is found | Feature that suits it |
|---|---|---|
| Mosses | damp, shaded ground and tree trunks | no true roots and no waterproof layer, so they dry out quickly in sun |
| Cacti | hot, dry deserts | thick stems store water; spines instead of leaves lose less water |
| Grasses | open ground in bright light | grow from the base, so they survive grazing and mowing |
| Earthworms | moist soil rich in rotting plant material | breathe through damp skin and eat decaying matter |
| Ferns | shaded, humid forest such as Waitākere bush | large fronds catch dim light |
Sampling with quadrats
- You cannot count every plant or insect in a field, so you count a few small samples and scale up.
- A quadrat is a square frame, often 0.5 m × 0.5 m (0.25 m²) or 1 m × 1 m, laid on the ground.
- In each quadrat you count the organisms, or estimate the percentage of the square they cover, which suits grass and moss that are hard to count.
- Place quadrats at random, for example using random numbers as grid coordinates, so you do not just pick the interesting spots.
- More quadrats give a more reliable average; five is a bare minimum and ten or more is better.
Estimating daisies on a school field
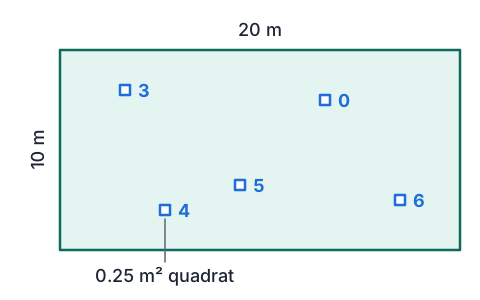
- A field is 20 m × 10 m. Five random 0.25 m² quadrats contain 3, 5, 0, 6 and 4 daisies.
- Estimate the total number of daisies on the field.
- 3 + 5 + 0 + 6 + 4 = 18total counted
- 18 ÷ 5 = 3.6 per quadratmean per quadrat
- 3.6 ÷ 0.25 = 14.4 per m²each quadrat is a quarter of a square metre
- 20 × 10 = 200 m²area of the field
- 14.4 × 200 = 2,880scale up to the whole field
- About 2,900 daisies
Transects: sampling along a change
- Quadrats at random tell you how much of something lives in one habitat. To see how life changes from one place to another, use a transect.
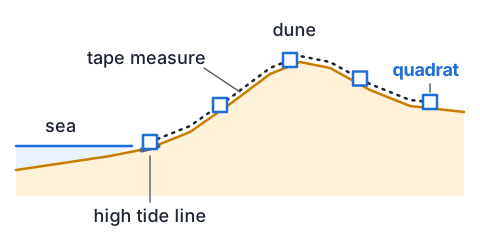
- Lay a tape measure in a straight line across the change, such as from the high tide line up a sand dune, or from open grass into bush.
- Place a quadrat at regular intervals along the tape, such as every 5 m, and record the organisms and the abiotic factors at each point.
- Plotting both against distance shows whether a change in conditions lines up with a change in organisms.
| Abiotic factor | Measured with | Unit |
|---|---|---|
| Light intensity | light meter or phone light sensor | lux |
| Air and soil temperature | thermometer or temperature probe | °C |
| Soil moisture | moisture probe, or weigh soil before and after drying | % water |
| Soil pH | pH meter or indicator kit | pH (no unit) |
| Soil composition | shake soil in a jar of water and measure the settled layers | % sand, silt and clay |
| Wind speed | anemometer | km/h or m/s |
Reading a sand dune transect
- A class ran a transect from the seaweed at the high tide line up a dune, with a 0.25 m² quadrat every 10 m.
- Explain where the sandhoppers and the marram grass are, using the abiotic data.
| Distance from high tide line (m) | 0 | 10 | 20 | 30 | 40 |
|---|---|---|---|---|---|
| Sandhoppers per quadrat | 42 | 6 | 0 | 0 | 0 |
| Marram grass cover (%) | 0 | 15 | 70 | 55 | 10 |
| Wind speed (km/h) | 25 | 22 | 18 | 9 | 6 |
| Sand moisture (%) | 12 | 4 | 3 | 5 | 8 |
- Sandhoppers: 42 at 0 m, none past 10 mfind where they peak
- 0 m is the dampest sand, under rotting seaweedthey need moisture and feed on the seaweed
- Marram peaks at 20 to 30 m, on the windy, dry duneit copes with drying and with being buried by blowing sand
- Behind the dune, wind drops and moisture rises, and marram fadessheltered ground suits other plants that crowd it out
- Each organism is most common where the abiotic conditions suit it
Leaf litter compared with bare ground
- Another class sorted invertebrates from equal 1 kg samples under bush leaf litter and from bare, exposed ground nearby, and measured conditions at each.
- The leaf litter held about six times as many animals, because it is cooler, damper and darker, and the rotting leaves are food.
- Exposed ground dries out and heats up in the sun, which kills animals that lose water through their skin, such as earthworms and slaters.
- Repeating the same survey each season, or each year, shows changes over time, such as a drop in numbers after a dry summer.
| Under leaf litter | Exposed ground | |
|---|---|---|
| Slaters | 14 | 1 |
| Earthworms | 9 | 2 |
| Beetles | 6 | 3 |
| Millipedes | 5 | 0 |
| Total | 34 | 6 |
| Temperature | 14 °C | 22 °C |
| Light | low | high |
| Moisture | damp | dry |
Mātauranga Māori: knowledge from long observation
- Mātauranga Māori is the knowledge system of Māori, built up over many generations of watching the land, sea and sky closely and passing on what was learned.
- Like science, it rests on patterns noticed again and again, and it is tested by whether its predictions hold, because fishing, planting and harvest depended on getting them right.
- The maramataka, the Māori lunar calendar, links phases of the Moon with the best days for fishing, planting and resting the land.
- Records kept over hundreds of years can reveal slow changes that a single school survey cannot.
Ngā tohu o te taiao: reading the signs
- Ngā tohu o te taiao are signs in the natural world that indicate a change of season or the state of an ecosystem.
- Seasonal tohu link one event to another, so noticing one tells you the other is happening.
- Health tohu show whether a place is thriving: plenty of healthy tuna (eels) and kōura (freshwater crayfish), and clear, clean-smelling water, point to a healthy stream.
- Today some councils and iwi use tohu alongside scientific measures, such as counting mayfly and stonefly larvae, which are found mostly in clean, well-oxygenated streams.
| Tohu | What it indicates |
|---|---|
| Kōwhai in flower | kina are full and ready to gather |
| Pīpīwharauroa (shining cuckoo) calling in spring | time to plant kūmara |
| Matariki rising before dawn in midwinter | a new year begins; clear, bright stars were read as a sign of a good season ahead |
| Plenty of healthy tuna and kōura | a healthy stream |
Common mistakes
- A fallen log or dead leaves are abiotic, because they are not alive any more.Recently living things count as biotic, because they still feed and shelter other organisms such as fungi, slaters and worms.
- Put the quadrats where there are lots of plants, so you get good data.Place quadrats at random, because choosing spots on purpose biases the sample and overestimates the numbers.
- With 0.25 m² quadrats, multiply the mean per quadrat straight by the area of the field.First divide the mean by 0.25 to get the number per m², otherwise the estimate comes out four times too small.
- To see how plants change from the beach up a dune, scatter quadrats at random.Use a transect, with quadrats at regular distances along a tape, because random quadrats cannot show change along a line.
Survey sun and shade in your garden
You need: a garden, lawn or park with a sunny and a shady patch, 2 m of string, 4 pencils or sticks, a ruler, gardening gloves, a notebook and pen
- Push the four sticks into the ground at the corners of a 50 cm square in a sunny, open patch, and loop the string round them to make a quadrat.
- Estimate the percentage of the square covered by grass, by moss and by bare soil, and push a finger into the soil to judge how damp it is.
- Gently lift one stone, pot or piece of wood next to the square, count the slaters, worms and other small animals under it, then put it back as it was.
- Repeat in a shady, damp patch, such as the south side of a fence or hedge, then do two more squares in each patch so you have three of each.
- Look for more grass in the sun, and more moss, damper soil and more slaters and worms in the shade, because those organisms dry out quickly in bright, warm conditions.
Safety: Soil can carry tetanus bacteria and potting mix can carry Legionella, so wear gloves, wash your hands well afterwards, and do not put fingers into gaps you cannot see into.
Your turn
- 1. Sort into biotic or abiotic: a dead kauri leaf, soil pH, a weta, rainfall, a fungus on a log.
- 2. Mosses grow thickly on the south side of a building but hardly at all on the north side. Suggest two abiotic factors that explain this, remembering New Zealand is in the Southern Hemisphere.
- 3. Six random 1 m² quadrats on a 300 m² lawn hold 2, 4, 1, 3, 0 and 2 clover plants. Estimate the clover on the lawn.
- 4. You want to know how plants change from a sunny paddock into the shade of bush. Would you use random quadrats or a transect? Say what you would measure.
- 5. Give one way a tohu and a scientific survey are alike, and one way they differ.
Show answer
1. Biotic: dead kauri leaf (recently living), weta, fungus. Abiotic: soil pH, rainfall. 2. In New Zealand the north side faces the Sun, so the south side gets less light and stays cooler and damper, which suits mosses that dry out easily. 3. Total 12, mean 2 per m², and 2 × 300 = about 600 plants. 4. A transect, because you are looking at change across a boundary. Measure light, temperature and soil moisture at each quadrat, and record the plants and their cover. 5. Alike: both rely on repeated observation of patterns and use them to make predictions. Different: tohu are passed on over generations and tied to place, while a survey uses measured numbers taken with instruments at set times.
What to take away
- Biotic factors are living or recently living; abiotic factors include air, water, temperature, light and minerals.
- Each organism lives where the conditions suit it, so places with different rainfall, temperature and plant cover hold different life.
- Places with similar conditions, such as damp shade or hot desert, hold similar kinds of organisms.
- Random quadrats estimate how many organisms there are; a transect shows how they change across a boundary, alongside measured light, temperature and soil.
- Repeating surveys over time reveals changes in an ecosystem.
- Mātauranga Māori and ngā tohu o te taiao come from long-term observation and track the seasons and the health of a place.
How is Year 9 maths going?
See the Year 9 maths guide