Planning data collection and sources of variation

What this lesson covers
- Data vary for many reasons, and a good plan anticipates the ones it can control.
- How data are collected or sourced decides what a conclusion can claim about the population.
The plan turns a question into instructions
- What exactly will be measured, and how?
- Who will be measured, and how many?
- Where does the data come from?
Primary or secondary data
- Primary: you collect it yourself.
- Secondary: someone else collected it.
- Either way, you must know how it was got.
| Data | Means | For example |
|---|---|---|
| Primary | you collect it yourself | survey, measure, time |
| Secondary | someone else collected it | Census at School, a report |
| Either way | you must know how it was got | or you cannot trust it |
Define the measurement exactly
- Resting pulse: when, how, and for how long.
- Count for 30 seconds, then double it.
- Written down so everyone does the same thing.
| Decision | Resting pulse rate |
|---|---|
| When | seated, after 2 minutes of rest |
| How | two fingers on the wrist, not the thumb |
| Count | beats in 30 seconds, then double |
| Record | whole beats per minute, e.g. 72 |
Natural variation
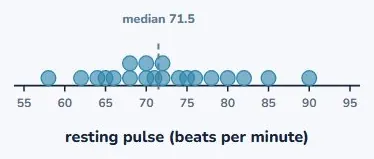
- Twenty careful measurements, twenty different people.
- They still spread from 58 to 90.
- People really do differ. That is not a mistake.
Measurement variation
- A miscount, a rounded value, a different method.
- The same pulse can be recorded differently.
- One clear method keeps this small.
Induced variation
- Some students measured just after PE.
- Their pulse is raised by the conditions, not by who they are.
- Keep conditions the same for everyone.
Sampling variation
- Three samples of 30, three different medians.
- Each one is an estimate of the population.
- Bigger random samples vary less.
| Sample | Who | Result |
|---|---|---|
| Sample A | 30 students | median 71.5 |
| Sample B | 30 other students | median 74 |
| Sample C | 30 more | median 69 |
| So | one median is an estimate | not the truth |
Four sources, four responses
- Natural variation is described, not removed.
- The other three you plan to reduce.
- Say which ones your data might have.
| Source | Cause | Response |
|---|---|---|
| Natural | people really differ | expected: describe it |
| Measurement | the recording slips | one clear method |
| Induced | conditions differ | same conditions for all |
| Sampling | another sample differs | bigger, random samples |
Choosing who to measure
- Random: everyone has a fair chance of being picked.
- Friends or volunteers give a lopsided sample.
- Aim for 30 per group, or 30 pairs.
| Method | Effect |
|---|---|
| Random | everyone has a fair chance |
| Friends only | convenient, but not typical |
| Volunteers | only the keen ones reply |
| Size | 30 per group, or 30 pairs |
Cleaning the data
- Look for values that cannot be right.
- Check before fixing, and never guess silently.
- Record every change you make.
| Value | Problem | Action |
|---|---|---|
| 720 | extra digit typed | check, then 72 |
| 7.2 | decimal point slipped | check, then 72 |
| (blank) | missing | leave out, say so |
| 112 | high but possible | keep, find out why |
Unusual is not the same as wrong
- A pulse of 112 is high, but a real person can have it.
- Deleting it makes the data look tidier than it is.
- Keep it, and look for a reason.
What the marker looks for
- Explain how the data were collected or sourced.
- Name the sources of variation you expect.
- Say what you did to reduce them.
What to take away
- Good data is planned, not hoped for.
| Primary or secondary | know how the data were got |
| Define the measure | so everyone records it the same |
| Natural | people really differ |
| Measurement | reduce with one clear method |
| Induced | keep conditions the same |
| Sampling | bigger, random samples |
| Cleaning | fix errors, keep real unusual values |
Your turn: four questions
- Pause here and answer each in a sentence.
- Name the source of variation where you can.
- Say what you would do about it.
| Question | |
|---|---|
| 1 | Some students get three goes at a reaction test, some get one. Problem? |
| 2 | Heights recorded: 162, 158, 1.71, 165 (cm). What needs fixing? |
| 3 | A sleep survey is posted on a class social media page. Problem? |
| 4 | A comparison of two groups: how many people at least? |
Show answer
1. Induced and measurement variation: the conditions differ between students. Give everyone the same number of goes, for example the mean of three. 2. 1.71 was recorded in metres. After checking, record it as 171 cm so every value has the same unit. 3. Volunteer bias: only people who see the post and choose to reply are included, so the sample is not random and may not represent the population. 4. 60: at least 30 in each of the two groups.
The answers
- Conditions differ: give everyone the same number of goes.
- 1.71 is in metres: check, then 171 cm.
- Volunteers only: not a random sample.
- 60: at least 30 in each group.
Is your child on track?
Take the free placement test