Comparing groups: box plots, shift and overlap
What this lesson covers
- Comparing two groups means comparing their whole distributions, not one number from each.
- Shift, overlap, spread and shape together decide how strong a comparison is.
A comparison question
- One numerical variable, two groups.
- Thirty students in each, chosen at random.
- Does one group tend to sleep longer?
| The investigation | |
|---|---|
| Question | Do sporty Year 11s tend to sleep longer? |
| Variable | hours of sleep on a school night |
| Groups | plays team sport: yes or no |
| Sample | 30 randomly chosen from each group |
The five-number summary
- Sort the 30 values from smallest to largest.
- The median splits them into two halves of 15.
- Each quartile is the median of one half.
| Sport group | Where | Value (h) |
|---|---|---|
| Minimum | smallest value | 6.5 |
| Lower quartile | 8th value of 30 | 8 |
| Median | mean of 15th and 16th | 8.75 |
| Upper quartile | 23rd value of 30 | 9.25 |
| Maximum | largest value | 10.5 |
Both groups side by side
- The interquartile range is Q3 minus Q1.
- It measures the spread of the middle 50%.
- Unlike the range, one extreme value cannot stretch it.
| Sport | No sport | |
|---|---|---|
| Median | 8.75 h | 7.75 h |
| Middle 50% | 8 to 9.25 | 7.25 to 8.5 |
| IQR | 1.25 h | 1.25 h |
| Range | 4 h | 4.5 h |
Two box plots, one scale
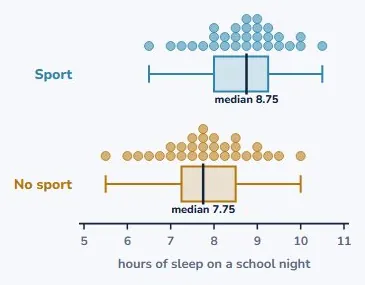
- The box runs from Q1 to Q3, with a line at the median.
- The whiskers reach the minimum and maximum.
- One shared scale, or no comparison is possible.
Shift: where the groups sit
- The sport median is 8.75 hours.
- The no-sport median is 7.75 hours.
- The whole sport box sits about an hour higher.
Five features to describe
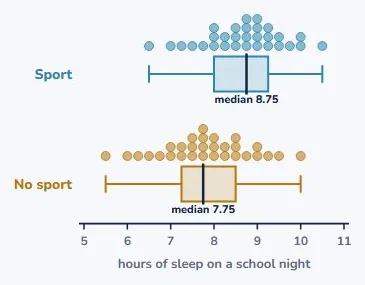
- Shift and overlap compare the groups.
- Spread and shape describe each group.
- Unusual values get named and explained.
| Feature | In this data |
|---|---|
| Shift | sport box sits about 1 hour higher |
| Overlap | middle 50% overlap from 8 to 8.5 |
| Spread | IQRs equal at 1.25 hours |
| Shape | both roughly symmetric |
| Unusual | no values far from the rest |
Overlap: how separate they are
- The middle halves overlap from 8 to 8.5 hours.
- So plenty of non-sporty students outsleep sporty ones.
- That is why the claim says "tend to".
Can you make a call?
- Rule of thumb for samples of about 30:
- is one median outside the other group's box?
- 8.75 is above 8.5, so yes.
| Check | Result |
|---|---|
| Sport median | 8.75 hours |
| No-sport box | 7.25 to 8.5 hours |
| Outside the box? | yes, above it |
| So | make a call: "tend to" |
When you cannot make a call
- If each median sits inside the other box...
- ...the difference could be sampling variation.
- Say so. That is a valid conclusion too.
The most common mistake
- Comparing one value from each group.
- A maximum is one student, not a tendency.
- Use the whole distribution.
| Weak | "The sport group has the highest value, 10.5" |
| Why weak | one person, not the group |
| Strong | medians, boxes and overlap together |
Writing the comparison
- A claim about the population, with "tend to".
- Evidence: statistics with units.
- An honest line about the overlap.
| Part | Sentence |
|---|---|
| Claim | sporty Year 11s tend to sleep longer |
| Evidence | median 8.75 h vs 7.75 h |
| Evidence | sport median above no-sport box |
| Honest | boxes overlap: not every sporty student |
Bring in the context
- Why might sport go with more sleep?
- Tiredness from training, earlier routines.
- A reason is a suggestion, not a proof.
What to take away
- Compare whole distributions, and say "tend to".
| Five numbers | min, Q1, median, Q3, max |
| IQR | Q3 minus Q1, the middle 50% |
| Same scale | always, or shift cannot be seen |
| Describe | shift, overlap, spread, shape, unusual |
| Call | one median outside the other box |
| Words | "tend to", in context, with numbers |
| Never | compare just one value from each |
Your turn: four questions
- Pause here. Sketch both box plots on one scale.
- Then answer questions 1 to 4.
- Use units and the context in every answer.
| Resting pulse (beats per minute) | |
|---|---|
| A | pulse: min 52, Q1 60, median 66, Q3 72, max 88 |
| B | pulse: min 58, Q1 66, median 74, Q3 80, max 96 |
| 1 | Find the IQR of group A. |
| 2 | Can you make a call? Explain. |
| 3 | Where do the middle 50% overlap? |
| 4 | "B is higher because its max is 96." Why is this weak? |
Show answer
1. 72 − 60 = 12 beats per minute. 2. Yes. B's median, 74, is above A's upper quartile, 72, so B's median is outside A's box, and group B tends to have higher resting pulse rates. 3. From 66 to 72 beats per minute. 4. It compares one value from each group, not the distributions. Compare medians, boxes and overlap instead.
The answers
- 72 − 60 = 12 beats per minute.
- Yes: B's median 74 is above A's box, which ends at 72.
- From 66 to 72 beats per minute.
- One value each, not the distributions.
Is your child on track?
Take the free placement test