Time series graphs: trend, seasonal pattern and unusual points

What this lesson covers
- A time series graph shows how one variable changes over time, and its features have names.
- Trend, seasonal pattern and unusual spikes are read separately and then described together.
A time series graph
- One variable, measured at regular times.
- Time always runs across.
- Often lost marks in the exam.
| Shows | ||
|---|---|---|
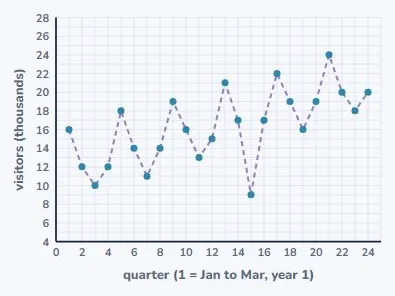
| Across | time, in quarters | 1 to 24, six years |
| Up | visitors, thousands | 9 to 24 |
| Q1 | January to March | summer |
| Q3 | July to September | winter |
Reading values first
- Read a value: go up from the time, across to the scale.
- Include the units: thousands of visitors.
- A change is one value minus another.
| Value | When | |
|---|---|---|
| Quarter 1 | 16 thousand | first summer |
| Quarter 3 | 10 thousand | first winter |
| Change | 16 − 10 = 6 thousand | summer to winter |
Six years of visitors
- A zigzag that climbs.
- Each zig is one year.
- Three features to read, separately.
Feature 1: the trend
- Ignore the zigzag. Where is it heading overall?
- Compare like with like: summer to summer.
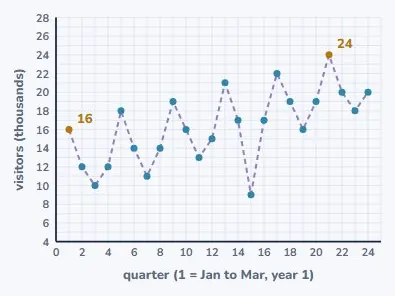
- Up 8 thousand in 5 years: 1.6 a year.
The trend, with numbers
- 16 thousand in the first summer.
- 24 thousand in the last.
- A rate makes the trend precise.
| Visitors | ||
|---|---|---|
| Summer, year 1 | 16 thousand | |
| Summer, year 6 | 24 thousand | |
| Change | 8 thousand in 5 years | 1.6 a year |
Feature 2: the seasonal pattern
- The same shape repeats every four quarters.
- Highest in quarter 1, lowest in quarter 3.
- Give the size of the swing: about 6 thousand.
| When | ||
|---|---|---|
| Peak | quarter 1 every year | summer |
| Trough | quarter 3 every year | winter |
| Swing | about 6 thousand | every year |
Feature 3: an unusual point
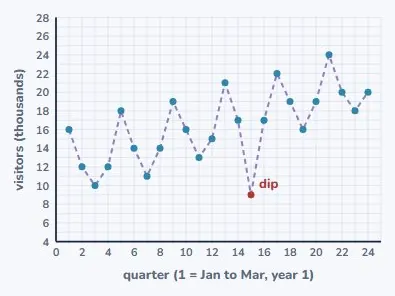
- Quarter 15 drops to 9 thousand.
- The pattern says about 15 thousand.
- Something happened: suggest what.
Explaining it from context
- A road closure, an exhibit shut, bad weather.
- Say "possibly": the graph cannot tell you.
- Do not let one dip change the trend.
All three, in context
- Each feature gets a sentence.
- Each sentence gets a number.
- Each number gets its units.
| Feature | Description |
|---|---|
| Trend | rising, about 1.6 thousand a year |
| Seasonal | peaks in summer, lowest in winter |
| Size | a swing of about 6 thousand |
| Unusual | quarter 15: 9 thousand, about 6 low |
A careful prediction
- Start from the latest same season.
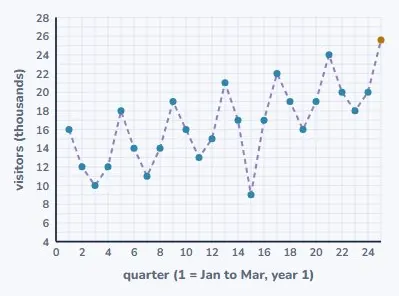
- Add a year of trend: 24 + 1.6.
- About 25 to 26 thousand next summer.
Why only "about"
- A prediction assumes the pattern continues.
- Quarter 15 shows it sometimes does not.
- Predict one season ahead, not ten years.
| Last summer | 24 thousand | |
| Trend | +1.6 thousand a year | |
| Next summer | 24 + 1.6 = 25.6 | about 25 to 26 thousand |
How the grades step up
- Achieved: one supported feature, in context.
- Merit: features with numbers from the graph.
- Excellence: reasons, prediction and caution.
What to take away
- Trend, season, unusual: each with a number.
| Time series | one variable over time |
| Trend | long-term direction, with a rate |
| Seasonal | when it peaks, when it dips, how much |
| Unusual | name it, give a possible reason |
| Separate | do not let a dip hide the trend |
| Predict | trend plus season, cautiously |
| Numbers | from the graph, in context |
Your turn: four questions
- Sketch the series if it helps.
- Pause here and answer each one.
- Compare like quarters with like.
| Question | |
|---|---|
| Data | Ice block sales ($1000s), Q1 to Q4. Y1: 18 9 5 12. Y2: 20 11 7 14. Y3: 22 13 9 16. |
| 1 | In which quarter do sales peak each year? |
| 2 | Describe the trend, with numbers. |
| 3 | Predict sales for Q1 of year 4. |
| 4 | Give one reason the prediction could be wrong. |
Show answer
1. Quarter 1, January to March, the summer quarter. 2. Rising: every quarter is $2000 higher than the same quarter the year before, and yearly totals rise from $44 000 to $52 000 to $60 000. 3. 22 + 2 = 24, so about $24 000. 4. For example: a cool, wet summer, a new competitor, or a price change; the prediction assumes the pattern continues.
The answers
- Quarter 1, the summer quarter.
- Up $2000 a quarter each year; totals 44, 52, 60.
- 22 + 2: about $24 000.
- e.g. a wet summer: it assumes the pattern holds.
Is your child on track?
Take the free placement test