Moving averages and the trend

What this lesson covers
- Average one full cycle at a time.
- Even cycles need centring.
- The result is the trend.
Centring
- A 4-point average sits between two quarters.
- Average two neighbouring values to centre it on a quarter.
Kōwhai Café
- Each 4-point average uses four quarters in a row.
| Quarter | Sales ($000) | 4-point average | Centred trend |
|---|---|---|---|
| Y1 Q1 | 40 | ||
| Y1 Q2 | 60 | 55 | |
| Y1 Q3 | 50 | 57 | 56 |
| Y1 Q4 | 70 | 59 | 58 |
| Y2 Q1 | 48 | 61 | 60 |
| Y2 Q2 | 68 | 63 | 62 |
| Y2 Q3 | 58 | ||
| Y2 Q4 | 78 |
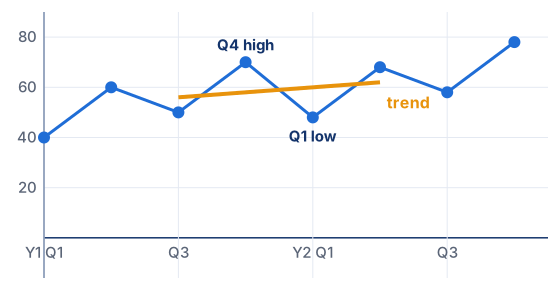
One line in full
- The centred value for Y1 Q3.
- (40 + 60 + 50 + 70) ÷ 4 = 55
- (60 + 50 + 70 + 48) ÷ 4 = 57
- (55 + 57) ÷ 2 = 56
Try it: find the trend
- Show the trend and watch the seasons disappear. Then add the seasonal pattern back to forecast.
Why four points work
- A full year holds each season once, and the seasonal effects add to zero, so they cancel.
- effects: −12 + 6 − 6 + 12 = 0
- an average of a year keeps only the trend
Try it: the moving average
Choosing the window
- Match the window to the cycle: 4 points for quarters, 12 for months, 7 for days of the week.
- An odd window, such as 7, is already centred. An even one needs centring.
Common mistakes
- Using a 3-point average on quarterly data.Use a full cycle of four.
- Plotting the 4-point average on a quarter.It must be centred first.
Your turn
How many points suit monthly data?
Find the 4-point average of 10, 20, 30, 40.
The next value is 50. Find the next 4-point average.
Find the centred value between those two averages.
Show answer
1. 12 2. 25 3. (20 + 30 + 40 + 50) ÷ 4 = 35 4. (25 + 35) ÷ 2 = 30
Sample question: Achieved
A Tauranga surf shop's quarterly sales, in thousands of dollars, start 61, 47, 38, 54, 65 (Year 1 Q1 to Year 2 Q1). Find the first two 4-point moving averages, and the centred moving average for Year 1 Q3.
Hint
Average four quarters in a row, then slide along one quarter and average again. The centred value is the mean of the two averages.
Answer
4-point averages 50 and 51; centred value for Year 1 Q3 is 50.5 thousand dollars ($50,500)
Step by step
- A 4-point moving average uses one full year of quarters, so the seasons cancel out.
- First average: (61 + 47 + 38 + 54) ÷ 4 = 200 ÷ 4 = 50.
- Slide along one quarter, dropping 61 and adding 65: (47 + 38 + 54 + 65) ÷ 4 = 204 ÷ 4 = 51.
- The first average sits halfway between Q2 and Q3. The second sits halfway between Q3 and Q4. Neither lines up with a quarter.
- Centre them: average the two, (50 + 51) ÷ 2 = 50.5. This value sits exactly at Year 1 Q3.
- Classic mistake: plotting 50 at Q2 or Q3 without centring. An even window always needs centring.
- So the trend at Year 1 Q3 is about 50.5 thousand dollars, which is $50,500.
- Check: 50.5 sits between 50 and 51, as it must.
Full working
- (61 + 47 + 38 + 54) ÷ 4 = 50first 4 quarters
- (47 + 38 + 54 + 65) ÷ 4 = 51slide along one
- (50 + 51) ÷ 2 = 50.5centre on Year 1 Q3
- 50, 51; centred 50.5 thousand dollars
Sample questions: Merit
The surf shop's sales, in thousands of dollars, for two years are: Year 1: 61, 47, 38, 54. Year 2: 65, 50, 43, 58. Find all the centred 4-point moving averages, say which quarters they belong to, and estimate how fast the trend is rising.
Hint
8 quarters give five 4-point averages and four centred values, from Year 1 Q3 to Year 2 Q2.
Answer
Centred trend: Y1 Q3 50.5, Y1 Q4 51.375, Y2 Q1 52.375, Y2 Q2 53.5. The trend rises about $1,000 a quarter.
Step by step
- Work out every 4-point average first. There are 8 − 3 = 5 of them.
- (61 + 47 + 38 + 54) ÷ 4 = 50. (47 + 38 + 54 + 65) ÷ 4 = 51. (38 + 54 + 65 + 50) ÷ 4 = 51.75.
- (54 + 65 + 50 + 43) ÷ 4 = 53. (65 + 50 + 43 + 58) ÷ 4 = 54.
- Centre each neighbouring pair: (50 + 51) ÷ 2 = 50.5, (51 + 51.75) ÷ 2 = 51.375, (51.75 + 53) ÷ 2 = 52.375, (53 + 54) ÷ 2 = 53.5.
- The first centred value belongs to Year 1 Q3, the third quarter, because it uses two quarters on each side of it.
- So the four centred values are at Y1 Q3, Y1 Q4, Y2 Q1 and Y2 Q2. The first two and last two quarters have none.
- Classic mistake: putting the first centred value at Year 1 Q1. A centred value needs data on both sides.
- Rate of the trend: it rose from 50.5 to 53.5 over 3 quarters, so (53.5 − 50.5) ÷ 3 = 1 thousand dollars, which is $1,000 a quarter.
- Check: every centred value is higher than the one before, so the trend really is rising steadily.
Full working
- 4-point averages: 50, 51, 51.75, 53, 54
- centred: 50.5, 51.375, 52.375, 53.5mean of each pair
- at Y1 Q3, Y1 Q4, Y2 Q1, Y2 Q2two quarters lost at each end
- (53.5 − 50.5) ÷ 3 = 1rise over 3 quarters
- Centred trend 50.5, 51.375, 52.375, 53.5; rising about $1,000 a quarter
A dairy records its daily sales, in hundreds of dollars, starting on a Monday: 30, 32, 35, 38, 52, 70, 45, 34 (Monday to the next Monday). Choose a suitable moving average, calculate the first two values, and say which days they belong to. Explain why no centring is needed.
Hint
The pattern repeats every week, so the window should be 7 days. A window with an odd number of values has a middle value.
Answer
A 7-point moving average: 302 ÷ 7 ≈ 43.14 (Thursday) and 306 ÷ 7 ≈ 43.71 (Friday), in hundreds of dollars. 7 is odd, so each average already sits on its middle day.
Step by step
- Match the window to the cycle. Daily sales repeat every week, so use 7 points: one of each day.
- Classic mistake: using a 4-point average because that is what quarterly data uses. Four days would mix the weekend into some averages and not others.
- First average, Monday to Sunday: (30 + 32 + 35 + 38 + 52 + 70 + 45) ÷ 7 = 302 ÷ 7 ≈ 43.14.
- Second average, Tuesday to the next Monday: (32 + 35 + 38 + 52 + 70 + 45 + 34) ÷ 7 = 306 ÷ 7 ≈ 43.71.
- Where does each one sit? Seven values have a middle one: the 4th. Monday to Sunday has Thursday in the middle.
- So the first average belongs to Thursday and the second to Friday.
- No centring is needed, because an odd window already lines up with a real day. Only even windows, like 4 or 12, fall between two values.
- In context, the trend is about $4,300 a day and rising slightly.
- Check: each average includes exactly one Saturday, the busy day, so the weekly pattern cancels out fairly.
Full working
- weekly cycle, so a 7-point windowone of each day
- (30 + 32 + 35 + 38 + 52 + 70 + 45) ÷ 7 = 302 ÷ 7 ≈ 43.14Thursday
- (32 + 35 + 38 + 52 + 70 + 45 + 34) ÷ 7 = 306 ÷ 7 ≈ 43.71Friday
- 7 is odd, so the middle value is a real dayno centring
- 43.14 (Thursday) and 43.71 (Friday) hundred dollars
Sample questions: Excellence
For quarterly data y1, y2, y3, y4, y5, show that the centred 4-point moving average at y3 equals y1 + 2y2 + 2y3 + 2y4 + y58. Check it with the surf shop data 61, 47, 38, 54, 65. Hence explain why the centred moving average removes the seasonal effect.
Hint
Write out the two 4-point averages, add them and halve. Then look at which quarters y1 and y5 are.
Answer
Centred value = (12) × (y1 + y2 + y3 + y44 + y2 + y3 + y4 + y54) = y1 + 2y2 + 2y3 + 2y4 + y58. Check: 404 ÷ 8 = 50.5. y1 and y5 are the same quarter, so each season gets a total weight of 2 out of 8; the four seasonal effects add to zero, so they cancel.
Step by step
- The first 4-point average is y1 + y2 + y3 + y44 and the second is y2 + y3 + y4 + y54.
- The centred value is the mean of these two: add them and divide by 2.
- Adding: y1 + 2y2 + 2y3 + 2y4 + y54, because y2, y3 and y4 appear in both.
- Divide by 2: y1 + 2y2 + 2y3 + 2y4 + y58. This is a weighted average of five quarters with weights 1, 2, 2, 2, 1.
- Check with the data: (61 + 2 × 47 + 2 × 38 + 2 × 54 + 65) ÷ 8 = (61 + 94 + 76 + 108 + 65) ÷ 8 = 404 ÷ 8 = 50.5. This matches the centred value from two averages.
- Now the seasons. y1 and y5 are four quarters apart, so they are the same season, for example both Q1.
- So that season gets weight 1 + 1 = 2, and each of the other three seasons gets weight 2. Every season counts equally: 2 out of 8.
- In an additive model each value is trend + seasonal effect + residual, and the four seasonal effects add to zero.
- With equal weights, the centred value contains 2 × (sum of the four effects) ÷ 8 = 0. The seasonal part cancels and the trend is left.
- Classic mistake: thinking a plain 5-point average would work. Weights 1, 1, 1, 1, 1 count one season twice, so the seasons would not cancel.
- This also shows why the first and last two quarters have no centred value: the formula needs two quarters on each side.
Full working
- (12) × (y1 + y2 + y3 + y44 + y2 + y3 + y4 + y54)mean of two averages
- = y1 + 2y2 + 2y3 + 2y4 + y58shown
- (61 + 94 + 76 + 108 + 65) ÷ 8 = 50.5check with data
- y1 and y5 are the same seasonweights 2, 2, 2, 2 by season
- effects add to 0, so 2 × 0 ÷ 8 = 0the season cancels
- Each season has equal weight 2 out of 8, so the seasonal effects cancel and only the trend is left
The surf shop's Year 2 Q1 sales were recorded as 95 instead of the usual 65, because of a one-off surfing competition. The other values are 61, 47, 38, 54 (Year 1) and 50, 43, 58 (Year 2 Q2 to Q4). Which centred moving averages does this change, and by how much? What does it do to the Q1 seasonal estimate, and what should the analyst do?
Hint
A change of 30 in one value shifts each centred value by 30 times that value's weight out of 8. Use the weights 1, 2, 2, 2, 1.
Answer
All four centred values rise: Y1 Q3 by 3.75, and Y1 Q4, Y2 Q1 and Y2 Q2 by 7.5 each. The Y2 Q1 seasonal estimate becomes 95 − 59.875 = 35.125 instead of 12.625. The analyst should investigate the value, replace it with a typical figure (or leave it out) when estimating the trend and seasonal effects, and report the competition as an outlier.
Step by step
- Each centred value is y1 + 2y2 + 2y3 + 2y4 + y58, using five quarters in a row.
- Year 2 Q1 is the 5th quarter, and it went up by 95 − 65 = 30.
- The centred value at Y1 Q3 uses quarters 1 to 5, where the 5th has weight 1. It rises by 30 × 1 ÷ 8 = 3.75.
- The centred values at Y1 Q4, Y2 Q1 and Y2 Q2 use quarters 2 to 6, 3 to 7 and 4 to 8. The 5th quarter has weight 2 in each, so each rises by 30 × 2 ÷ 8 = 7.5.
- So one wrong value bends the trend upwards across a whole year of the series.
- Before, the centred value at Y2 Q1 was 52.375, so the Q1 estimate was 65 − 52.375 = 12.625.
- Now it is 52.375 + 7.5 = 59.875, and the estimate is 95 − 59.875 = 35.125, almost three times as big.
- The other estimates are pulled down too, because the trend under them is too high.
- Classic mistake: thinking a moving average smooths away a single outlier. It spreads it out instead, over several centred values.
- What to do: check the record, explain the cause, and use a typical value for that quarter, or leave it out, when finding the trend and seasonal effects.
- Report it as an outlier with its reason, and do not let it shape forecasts for future Q1s.
Full working
- change = 95 − 65 = 30 in quarter 5
- Y1 Q3: 30 × 1 ÷ 8 = 3.75weight 1
- Y1 Q4, Y2 Q1, Y2 Q2: 30 × 2 ÷ 8 = 7.5 eachweight 2
- Y2 Q1 trend 52.375 + 7.5 = 59.875
- Q1 estimate 95 − 59.875 = 35.125, not 12.625inflated
- Up 3.75, 7.5, 7.5, 7.5; Q1 estimate inflated to 35.125; treat 95 as an outlier
What to take away
- Average a full cycle to remove the season.
- Centre it before using it.
Practise this
Report a mistake
More in AS 91580


Is your child on track?
Take the free placement test