Formal confidence intervals

What this lesson covers
- For a mean: x̄ ± 1.96 × s ÷ √n.
- Bootstrap intervals use the middle 95%.
- Larger samples give narrower intervals.
A mean
- Mean 170 cm, s = 10, n = 100.
- 1.96 × 10 ÷ √100 = 1.96
- 170 − 1.96 = 168.04
- 170 + 1.96 = 171.96
- 168.04 to 171.96 cm
Try it: a bootstrap interval
How to say it
- We are fairly sure the population mean is between 168.04 and 171.96 cm.
- The interval is about the mean, not individual people.
What 95% really means
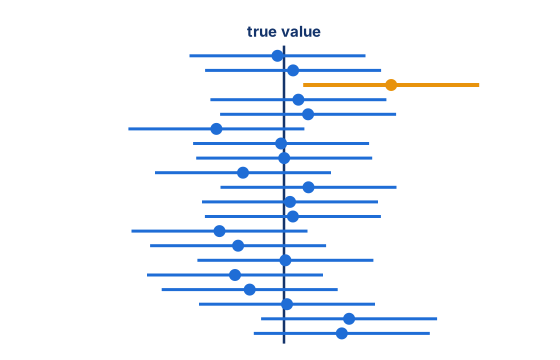
- Each line is an interval from a different sample of the same population. About 19 in 20 catch the true value. Here one misses.
- Your one interval either caught it or did not. The 95% describes the method.
Try it: what 95% really means
What sample size does
- With s = 10, compare n = 100 with n = 400.
- n = 100: 1.96 × 10 ÷ 10 = 1.96
- n = 400: 1.96 × 10 ÷ 20 = 0.98
- Four times the sample halves the margin
Statistics explorer
Common mistakes
- Saying 95% of people lie in the interval.It estimates the population mean.
- Forgetting the square root.Divide s by √n.
Your turn
Mean 40, s = 8, n = 64. Find the margin.
What is the interval?
To halve the margin, how must n change?
About how many of 20 such intervals catch the true value?
Show answer
1. 1.96 × 8 ÷ 8 = 1.96 2. 38.04 to 41.96 3. Multiply it by 4 4. About 19
Sample question: Achieved
A random sample of 64 kiwifruit from a Te Puke orchard has a mean weight of 102 g and a standard deviation of 12 g. Find the 95% confidence interval for the mean weight of all kiwifruit in the orchard.
Hint
Use x̄ ± 1.96 × s ÷ √n.
Answer
99.06 g to 104.94 g
Step by step
- The rule for a 95% interval for a mean is x̄ ± 1.96 × s ÷ √n.
- Here x̄ = 102, s = 12 and n = 64.
- Square root first: √64 = 8. Forgetting the square root is the classic mistake.
- Margin: 1.96 × 12 ÷ 8 = 1.96 × 1.5 = 2.94 g.
- Lower limit: 102 − 2.94 = 99.06 g. Upper limit: 102 + 2.94 = 104.94 g.
- Check: the sample mean 102 is exactly in the middle of the interval.
Full working
- margin = 1.96 × 12 ÷ √64x̄ ± 1.96 × s ÷ √n
- = 1.96 × 12 ÷ 8 = 2.94
- 102 − 2.94 = 99.06, 102 + 2.94 = 104.94
- 99.06 g to 104.94 g
Sample questions: Merit
A random sample of 49 Year 13 students at a Nelson school gives a mean of 7.3 hours sleep on school nights, with standard deviation 1.4 hours. The principal says students at the school average at least 8 hours. Construct a 95% confidence interval, interpret it, and say whether it supports the principal.
Hint
Build the interval, then see where 8 sits compared with the whole interval.
Answer
6.91 to 7.69 hours. I am fairly sure the mean sleep on school nights of all Year 13 students at the school is between 6.91 and 7.69 hours. The whole interval is below 8, so the data do not support the principal's claim; it suggests the mean is less than 8 hours.
Step by step
- Recall the rule: x̄ ± 1.96 × s ÷ √n, with x̄ = 7.3, s = 1.4 and n = 49.
- √49 = 7, so the margin is 1.96 × 1.4 ÷ 7 = 1.96 × 0.2 = 0.392 hours.
- Lower limit: 7.3 − 0.392 = 6.908. Upper limit: 7.3 + 0.392 = 7.692.
- Round sensibly: 6.91 to 7.69 hours.
- Interpret it with the population (Year 13 students at this school), the variable (sleep on school nights) and the parameter (the mean).
- So: I am fairly sure the mean sleep of all Year 13 students at the school on school nights is between 6.91 and 7.69 hours.
- Now the claim. The principal says at least 8. Where is 8? Above the top of the interval.
- Every believable value for the mean is under 8, so the data do not support the principal. They suggest the mean is below 8.
- Classic mistake: saying no student sleeps 8 hours. The interval is about the mean, not about single students.
- Check: 7.69 < 8, so 8 is outside the interval.
Full working
- margin = 1.96 × 1.4 ÷ √49 = 0.392
- 7.3 − 0.392 = 6.908, 7.3 + 0.392 = 7.692
- population: Year 13 students at the schoolparameter: mean sleep
- 8 > 7.69whole interval below 8
- 6.91 to 7.69 h; the claim of at least 8 h is not supported
A researcher wants a 95% confidence interval for the mean height of Year 9 students with a margin of error of at most 0.5 cm. A pilot study suggests s ≈ 6 cm. What is the smallest sample size she can use?
Hint
Set 1.96 × s ÷ √n ≤ 0.5 and solve for n, then round up.
Answer
n = 554
Step by step
- The margin of error is 1.96 × s ÷ √n. We want it to be 0.5 or less.
- Put in s = 6: 1.96 × 6 ÷ √n ≤ 0.5, so 11.76 ÷ √n ≤ 0.5.
- Rearrange: √n ≥ 11.76 ÷ 0.5 = 23.52.
- Square both sides: n ≥ 23.52² = 553.19.
- n must be a whole number. Rounding down to 553 would make the margin slightly too big, so round up.
- Classic mistake: rounding to the nearest whole number. For a sample size you always round up.
- Check n = 553: 1.96 × 6 ÷ √553 = 0.5001, just over. Check n = 554: 0.4996, under 0.5.
- So the smallest sample is 554 students.
Full working
- 1.96 × 6 ÷ √n ≤ 0.5margin at most 0.5
- √n ≥ 11.76 ÷ 0.5 = 23.52
- n ≥ 23.52² = 553.19
- n = 553 gives 0.5001, n = 554 gives 0.4996round up
- n = 554
Sample questions: Excellence
A 95% confidence interval for the mean travel time to school, from a random sample of 100 students at a Hamilton school, is 23.6 to 28.4 minutes. Find the sample mean and the sample standard deviation. Hence predict the interval if a sample of 400 had given the same mean and standard deviation. A newsletter says "95% of our students travel between 23.6 and 28.4 minutes". Evaluate this.
Hint
The mean is the midpoint and the margin is half the width; then solve 1.96 × s ÷ √100 = margin for s.
Answer
Mean 26 minutes, s ≈ 12.2 minutes. With n = 400 the margin halves to 1.2, giving about 24.8 to 27.2 minutes. The newsletter is wrong: the interval estimates the mean travel time of all students at the school, not the times of individual students, which spread far more widely (s is about 12 minutes).
Step by step
- The interval is mean ± margin, so the mean is in the middle: (23.6 + 28.4) ÷ 2 = 26 minutes.
- The margin is half the width: (28.4 − 23.6) ÷ 2 = 2.4 minutes.
- Now use the margin rule backwards: 1.96 × s ÷ √100 = 2.4, so 1.96 × s ÷ 10 = 2.4.
- Solve: s = 2.4 × 10 ÷ 1.96 = 12.24, so s ≈ 12.2 minutes.
- Hence n = 400. √400 = 20, twice √100, so the margin halves: 2.4 ÷ 2 = 1.2 minutes.
- The interval would be 26 ± 1.2, which is 24.8 to 27.2 minutes.
- Now the newsletter. It talks about 95% of students, so it treats the interval as a range for individuals.
- The interval is about one number: the mean travel time of all students at the school.
- Individual times vary a lot. A standard deviation of about 12 minutes means many students take 10 minutes or 45 minutes, far outside 23.6 to 28.4.
- Also, 95% describes the method: about 95% of intervals made this way catch the true mean. It is not a percentage of students.
- Better wording: I am fairly sure the mean travel time of all students at the school is between 23.6 and 28.4 minutes.
- Check: 1.96 × 12.24 ÷ 10 = 2.40, matching the margin.
Full working
- x̄ = (23.6 + 28.4) ÷ 2 = 26midpoint
- margin = (28.4 − 23.6) ÷ 2 = 2.4half the width
- 1.96 × s ÷ 10 = 2.4, so s = 24 ÷ 1.96 ≈ 12.2
- n = 400: margin = 1.96 × 12.24 ÷ 20 = 1.2four times n halves the margin
- 26 ± 1.2 = 24.8 to 27.2
- interval is for the mean, not individualsnewsletter is wrong
- x̄ = 26, s ≈ 12.2; about 24.8 to 27.2 min; the claim misreads the interval
The Ministry says the mean nightly sleep of NZ teenagers is 7.5 hours. A blogger takes 20 separate random samples and makes a 95% confidence interval from each. Nineteen intervals contain 7.5; one, 7.6 to 8.1 hours, does not. The blogger publishes only that one and says "this proves the Ministry is wrong". How many of the 20 intervals would you expect to miss if the Ministry is right? Evaluate the blogger's claim.
Hint
95% describes the method: think about how many of 20 intervals you expect to miss the true value even when it is exactly right.
Answer
About 1 of 20 is expected to miss (20 × 0.05 = 1). One miss in twenty is exactly what the method predicts if the Ministry is right, so it is not evidence against 7.5. Reporting only the interval that missed and hiding the other 19 is cherry-picking. Taken together, the 20 samples are consistent with a mean of 7.5 hours.
Step by step
- Recall what 95% means. If you made intervals from many random samples, about 95% of them would catch the true mean and about 5% would miss.
- So even when the true mean really is 7.5, some intervals miss it, just by chance.
- Expected misses out of 20: 20 × 0.05 = 1.
- The blogger got exactly 1 miss. That is what we expect if the Ministry is right.
- Any single interval either caught the true value or did not. You cannot tell which, so one interval does not prove anything.
- The blogger chose the one interval that missed and ignored the other 19. That is cherry-picking: picking the result that suits the story.
- Look at all 20 together. Nineteen contain 7.5, so the evidence as a whole fits a mean of 7.5 hours.
- Also, data support or fail to support a claim; they never prove it. Proves is the wrong word.
- A fair report would give all 20 results, or combine the samples into one large sample with a narrower interval.
- Conclusion: the claim is not justified.
Full working
- P(an interval misses) ≈ 0.0595% describes the method
- expected misses = 20 × 0.05 = 1
- observed: 1 miss of 20as expected if 7.5 is right
- publishing only the miss is cherry-picking
- 19 of 20 contain 7.5consistent with the Ministry
- expect about 1 miss; the claim is not justified
What to take away
- The interval estimates a population value.
- Quadruple n to halve the width.
Report a mistake
More in AS 91582



Is your child on track?
Take the free placement test