Grouped tables, clustered bar graphs, and reading them
What this lesson covers
- Continuous numerical data can be organised in a table by grouping data into specific ranges of values.
- Paired categorical data can be visualised with a clustered bar graph; one variable is represented on the horizontal axis, the other variable is shown by coloured bars clustered side-by-side, and the colours are explained in a key.
- Interpreting a data visualisation includes describing its variables and their units, the context for the data, and the visualisation’s key features: its shape (e.g. the number of peaks) its middle group(s) (where the middle of the data lies) its spread (how spread the data is from the minimum (lowest) value to the maximum (highest) value).
What does "interpret this graph" even mean?
- It is the vaguest instruction in school maths.
- Most people answer "it goes up" and stop, because who knows?
- The curriculum quietly lists five things. So there is an answer.
| an interpretation must say | in other words |
|---|---|
| the variables and units | what was measured |
| the context | who, and when |
| shape, middle, spread | what the graph actually shows |
27 heights is a list, not a table
- Measure 27 people to the nearest cm and you get 27 numbers.
- Nearly all different, so a tally gives 27 rows of one.
- That shows nothing. Group them into ranges instead.
| height | tally |
|---|---|
| 141 cm | 1 |
| 143 cm | 1 |
| 144 cm | 1 |
| and 24 more rows | 1 each |
Grouped, it says something
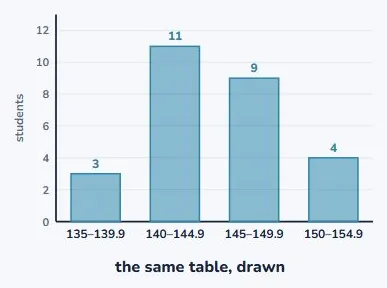
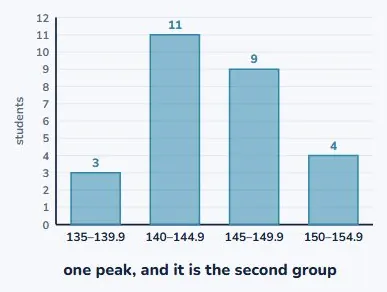
- Four ranges, five centimetres each.
- Now you can see where most of the class sits.
- And the frequencies still add to 27, so nobody was lost.
| height range | how many |
|---|---|
| 135–139.9 cm | 3 |
| 140–144.9 cm | 11 |
| 145–149.9 cm | 9 |
| 150–154.9 cm | 4 |
The ranges must not overlap
- Write 140–145 and 145–150 and you have a problem.
- Where does 145 go? You will decide differently each time.
- So the ranges touch without overlapping: 140–144.9, then 145.
| ranges written as | the problem |
|---|---|
| 140–145, 145–150 | where does 145 go? |
| 140–144.9, 145–149.9 | nowhere to argue |
Answering questions from it
- How many are between 140 and 145 cm? Read it off: 11.
- How many are 145 or taller? Add two rows: 9 + 4 = 13.
- What you cannot do is say how many are exactly 142.
Two variables, one graph
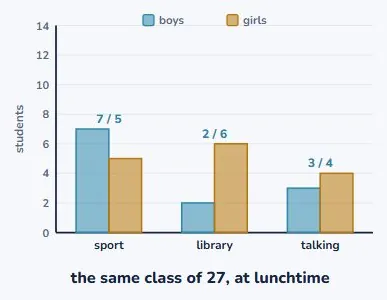
- Paired categories go in a clustered bar graph.
- One variable along the bottom: the lunchtime activity.
- The other by colour, in bars side by side.
Without a key it is not a graph
- The colours have to be explained somewhere on the page.
- That explanation is called the key.
- A coloured graph with no key is not hard to read. It is unreadable.
| part of the graph | what it tells you |
|---|---|
| the horizontal axis | the first variable |
| the colours | the second variable |
| the key | which colour is which |
Now compare the pairs
- Sport: 7 boys against 5 girls, so more boys.
- Library: 2 boys against 6 girls, the other way round.
- That comparison is exactly what a clustered graph is for.
| at lunchtime | boys | girls | which is more |
|---|---|---|---|
| sport | 7 | 5 | boys |
| library | 2 | 6 | girls |
| talking | 3 | 4 | girls |
Stacked answers a different question
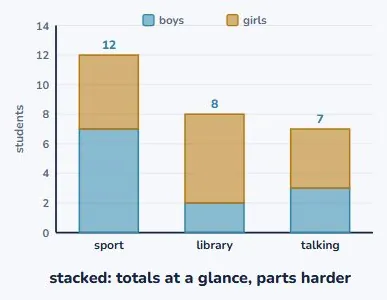
- Stack the same two colours instead of clustering them.
- Now the total for each activity is easy to read.
- But comparing boys with girls got harder. Pick to suit the question.
The five things, in order
- Variables and units. Context. Shape. Middle. Spread.
- Say all five and you have interpreted the graph.
- And, just as useful, you know when to stop.
| say | ask yourself | for our heights |
|---|---|---|
| variables and units | what is measured? | height, in centimetres |
| context | who, and when? | our class, this term |
| shape | how many peaks? | one peak, at 140–144.9 |
| middle | where is the middle? | the 140–144.9 group |
| spread | lowest to highest? | 135 up to 154.9 cm |
Shape means how many peaks
- Look along the bars: up to a high point, then down.
- One high point, so we say it has one peak.
- The peak is the 140 to 144.9 group, with 11 students.
Middle and spread
- 27 students, so the middle one is the 14th.
- Counting up: 3, then 14, so the 14th is in the second group.
- And the spread runs from 135 cm up to 154.9 cm.
| group | how many | running total |
|---|---|---|
| 135–139.9 | 3 | 3 |
| 140–144.9 | 11 | 14 |
| 145–149.9 | 9 | 23 |
| 150–154.9 | 4 | 27 |
Your turn
- 1. What is wrong with the groups 0–2, 2–4, 4–6?
- 2. From our table, how many students are under 145 cm?
- 3. Which graph shows totals best: clustered or stacked?
- 4. Name the five things an interpretation must include.
Show answer
1. 2 and 4 each belong to two groups. Use 0–1.9, 2–3.9, 4–5.9. 2. 3 + 11 = 14. 3. Stacked: the whole bar is the total. 4. Variables and units, context, shape, middle, spread.
What to take away
- Group continuous data into ranges that touch but never overlap.
- A clustered graph compares parts; a stacked one shows totals.
- And an interpretation is five specific things, not an opinion.
| job | the move |
|---|---|
| too many different values | group into equal ranges |
| paired categories | clustered bars, plus a key |
| reading a total | stack them instead |
| interpreting | variables, context, shape, middle, spread |
Is your child on track?
Take the free placement test