The mean, the median, the mode and the range
What this lesson covers
- A variable is an attribute or measurement of the people or objects being studied. A categorical variable classifies objects or individuals into groups.
- The response to a statistical question can be summarised by a measure of central tendency: the mean, the median, or the mode.
- The response to a statistical question can be summarised by the range as a measure of spread. The range for numerical data is the highest value minus the lowest value.
The average shoe size is 5.3
- Nobody in the class wears a 5.3.
- That is not a mistake.
- And "average" turns out to mean three different things.
First, what you are measuring
- A variable is the thing you record about each person.
- Shoe size. Height. Favourite sport.
- Some are numbers, some are groups.
| Variable | What it is | Type |
|---|---|---|
| Shoe size | a measurement | numerical |
| Height in cm | a measurement | numerical |
| Favourite sport | a group you belong to | categorical |
| How you get to school | a group you belong to | categorical |
Numerical or categorical
- Numerical: a measurement you can do maths on.
- Categorical: which group you fall into.
- You cannot take the mean of "rugby".
| Variable | What it is | Type |
|---|---|---|
| Shoe size | a measurement | numerical |
| Height in cm | a measurement | numerical |
| Favourite sport | a group you belong to | categorical |
| How you get to school | a group you belong to | categorical |
Planning before collecting
- Start with a question: are our feet the same length?
- Decide what to measure, from whom, and how.
- Decide the rounding before you start, not after.
| Decide | Here | |
|---|---|---|
| The question | Are our feet the same length? | |
| The variable | foot length | numerical |
| Who from | everyone in the class | |
| How measured | ruler, to the nearest cm |
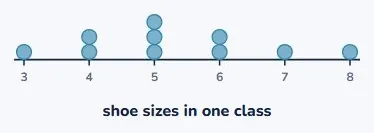
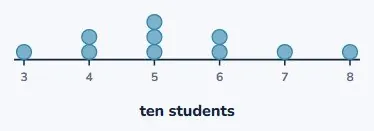
A dot plot shows the whole set
- One dot per person, stacked over its value.
- Now you can see the shape of the data.
- And all three averages are already visible.
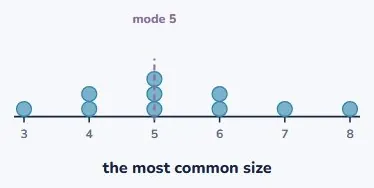
The mode is the tallest stack
- Whichever value has the most dots.
- Three people wear a 5. Nothing else has three.
- The mode is 5.
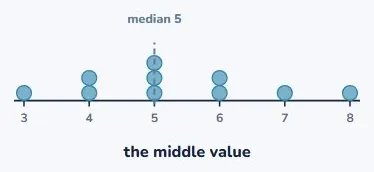
The median is the middle dot
- Line them up in order and go to the middle.
- Ten values, so the middle is between the 5th and 6th.
- Both are 5, so the median is 5.
Doing that carefully
- Sorting first is not optional. It is the whole method.
- With an even count there is no single middle.
- Take the two in the middle and go halfway.
| Step | Working | Result |
|---|---|---|
| Sort them | 3 4 4 5 5 5 6 6 7 8 | |
| Ten values | so no single middle | |
| Take the 5th and 6th | 5 and 5 | |
| Halfway between | 5 |
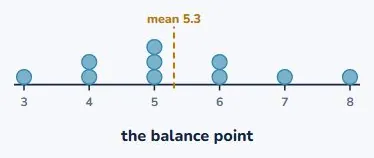
The mean shares everything out
- Add every value, then divide by how many there are.
- It is what everyone would have if it were shared equally.
- Which is why it does not have to be a real value.
Working out the mean
- The ten sizes total 53.
- 53 ÷ 10 = 5.3.
- No shoe shop sells a 5.3. It is still the right answer.
| Step | Working | Result |
|---|---|---|
| Add them all | 3+4+4+5+5+5+6+6+7+8 | 53 |
| How many | 10 | |
| Divide | 53 ÷ 10 | 5.3 |
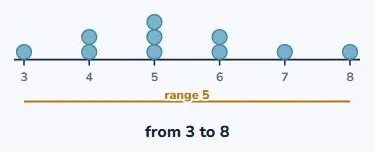
The range is the spread
- Highest take away lowest.
- 8 − 3 = 5.
- It says how spread out, not where the middle is.
All four together
- Three of them describe the middle.
- One describes the spread.
- A summary usually needs one of each.
| Measure | Means | Here |
|---|---|---|
| Mode | the most common value | 5 |
| Median | the middle value | 5 |
| Mean | shared out equally | 5.3 |
| Range | highest minus lowest | 5 |
Now watch what one odd value does
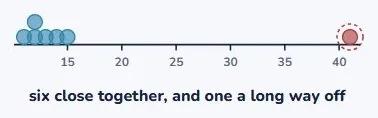
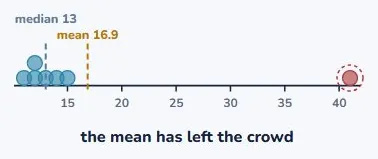
- A different data set, with one very large value.
- Six values clustered together, and a 41.
- That 41 is called an outlier.
It drags the mean, not the median
- The mean is 16.9, bigger than six of the seven values.
- The median is 13, right in the cluster.
- The mean was pulled. The median was not.
By how much
- Take the 41 out and the mean drops to 12.8.
- The median only moves from 13 to 12.5.
- One value moved the mean eight times as far.
| Data | Mean | Median |
|---|---|---|
| With the 41 | mean 16.9 | median 13 |
| Without it | mean 12.8 | median 12.5 |
| Moved by | 4.1 | 0.5 |
So which one do you use?
- For categories, only the mode works at all.
- With an extreme value, the median is safer.
- The mean uses everything, including the extreme value.
| Measure | When |
|---|---|
| Mode | the only one that works for categories |
| Median | safest when there is an extreme value |
| Mean | uses every value, but one big one drags it |
Your turn: four questions
- Pause here and try all four.
- On question 2, sort them before you do anything.
- That is where most marks are lost.
| Question | |
|---|---|
| 1 | Find the mode of 2, 3, 3, 5, 7, 3, 8. |
| 2 | Find the median of 4, 9, 2, 7, 5. |
| 3 | Find the mean of 6, 8, 10, 12. |
| 4 | Find the range of 14, 9, 22, 17. |
Show answer
1. 3. It appears three times, more than anything else. 2. 5. Sorted they are 2, 4, 5, 7, 9, and 5 is the middle one. 3. 9. They total 36, and 36 ÷ 4 = 9. 4. 13. The highest is 22 and the lowest is 9.
The answers
- The mode is 3; it appears three times.
- Sorted, the median is 5. The mean is 36 ÷ 4 = 9.
- The range is 22 − 9 = 13.
| Answer | |
|---|---|
| 1 | mode 3 |
| 2 | median 5 |
| 3 | mean 9 |
| 4 | range 13 |
What to take away
- Three averages: mode, median, mean. They can disagree.
- Always sort before finding a median.
- One extreme value drags the mean and barely moves the median.
| Remember | |
|---|---|
| Mode | most common: the tallest stack |
| Median | middle; sort them first, always |
| Mean | add and divide; uses every value |
| Range | highest minus lowest, a measure of spread |
| One extreme value | moves the mean a lot, the median barely |
Is your child on track?
Take the free placement test