Choosing the right graph, and outliers
What this lesson covers
- Categorical data can be visualised through dot plots and bar graphs.
- Paired categorical variables can be visualised through a stacked bar graph or a clustered bar graph.
- Bivariate time-series data can be visualised through a time-series graph.
- A good data visualisation should allow viewers to discern the variable or variables and who the data was collected from.
- Outliers are individual data points that are very much bigger or smaller than most of the data points.
- Outliers skew the mean value for a data set towards themselves, but not the median value.
- Outliers are not necessarily an error, as there are some events that occur rarely in many situations.
Which graph should you draw?
- It feels like a matter of taste. It is not.
- The kind of data you have decides it.
- Choose wrongly and the graph cannot answer the question.
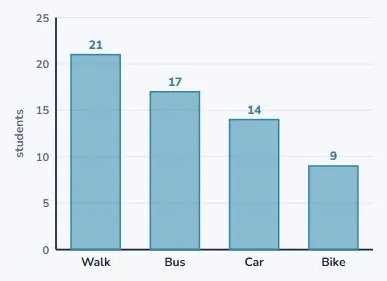
Categories get a bar graph
- Walk, bus, car, bike: these are groups, not numbers.
- One bar per group, height is how many.
- The bars have gaps, because the groups are separate.
Measurements get a dot plot
- When each value is a number on a scale.
- One dot each, stacked over its value.
- Now you can see the shape of the data.
Two categories at once
- Now split each group by year level.
- Two variables about the same students.
- There are two ways to draw that.
| Graph | Looks like | Good for |
|---|---|---|
| Clustered | bars side by side | compare the parts |
| Stacked | bars on top of each other | read the total |
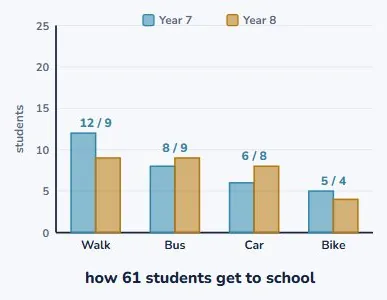
Clustered: side by side
- Two bars in each group, one per year level.
- Easy to compare the two directly.
- Year 8 takes the bus more than Year 7.
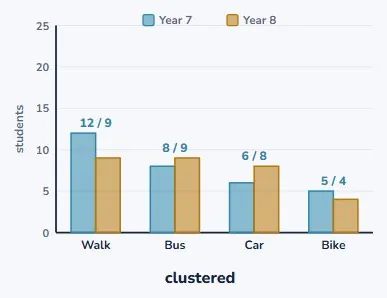
Stacked: one on top of the other
- Exactly the same numbers.
- Now each bar is the total for that group.
- 21 people walk, and you can read that instantly.
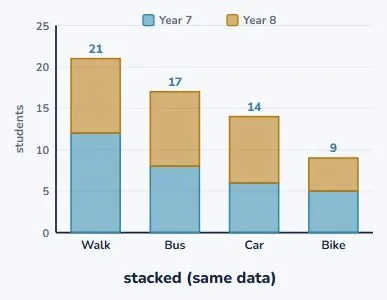
So which of those two?
- This is the one genuine choice in the topic.
- Comparing the two year levels? Clustered.
- Comparing the totals? Stacked.
| Graph | Looks like | Good for |
|---|---|---|
| Clustered | bars side by side | compare the parts |
| Stacked | bars on top of each other | read the total |
Measured over time
- One thing measured again and again.
- Time along the bottom, the measurement up the side.
- Join the points, because they follow on.
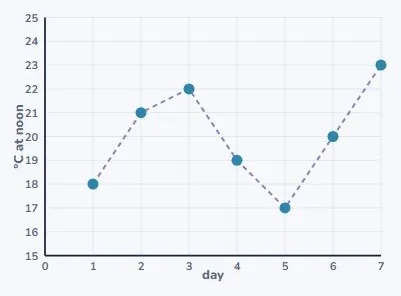
This one does not start at zero
- The temperatures run from 17 to 23.
- Drawn from zero it would be a flat line at the top.
- And the day-to-day change would vanish.
The whole decision, in one table
- Look at what kind of data you have.
- The graph follows from that.
- There is only one real choice in the list.
| Data | Graph | Example |
|---|---|---|
| Categories, one variable | bar graph | favourite sport |
| Measurements, one variable | dot plot | shoe sizes |
| Two categories paired | clustered or stacked bar | transport by year |
| Measured over time | time-series graph | daily temperature |
What every graph must carry
- A reader who did not collect the data needs telling.
- What it is about, what each axis is, what the units are.
- And who it was collected from.
| Needs | So a reader knows |
|---|---|
| A title | what the graph is about |
| Axis labels | what each axis measures |
| Units | mm, °C, students |
| A scale | starting where it says it starts |
| Who from | 61 students at one school, one week |
Missing parts hide things
- A graph with no units could be millimetres or metres.
- A scale not starting at zero can exaggerate a difference.
- Sometimes careless. Sometimes deliberate.
| Needs | So a reader knows |
|---|---|
| A title | what the graph is about |
| Axis labels | what each axis measures |
| Units | mm, °C, students |
| A scale | starting where it says it starts |
| Who from | 61 students at one school, one week |
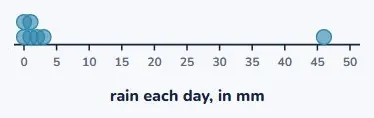
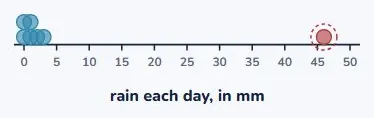
One dot a long way from the rest
- Six days between 0 and 3 mm of rain.
- Then one day with 46.
- That is an outlier.
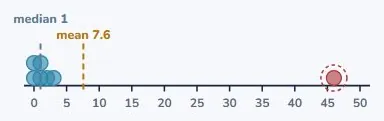
It pulls the mean towards itself
- The mean for the week is 7.6 mm.
- Six of the seven days had less than 3.
- The median is 1 mm, which describes the week better.
But it is not a mistake
- 46 mm is a real storm. It really rained.
- Deleting it would hide the most important day.
- An outlier is a thing to explain, not to remove.
| What you do | Result | |
|---|---|---|
| Delete it | the week looks dry | dishonest |
| Keep it, report both | mean 7.6, median 1 | honest |
| Say what happened | one storm on Friday | best |
How to report it honestly
- Give both summaries: mean 7.6, median 1.
- Then say what happened: a storm on the Friday.
- That is a finding, not an inconvenience.
| Fact | Value | Note |
|---|---|---|
| Six ordinary days | 0 to 3 mm | |
| Friday | 46 mm | a real storm |
| Mean for the week | 53 ÷ 7 | 7.6 mm |
| Median | the middle day | 1 mm |
When it IS worth checking
- A height of 1700 cm is not a tall person.
- That one is a decimal point in the wrong place.
- Ask whether the value is possible, not whether it is tidy.
| Value | Possible? | So |
|---|---|---|
| 46 mm of rain | yes, a storm | keep it |
| 1700 cm tall | no | check the record |
| A test score of 105 out of 100 | no | check the record |
Your turn: four questions
- Pause here and try all four.
- For 1 and 2, name the data type first.
- The graph follows from that.
| Question | |
|---|---|
| 1 | You record favourite sport for 30 students. Which graph? |
| 2 | You record the noon temperature every day for a fortnight. Which graph? |
| 3 | Name the outlier in 4, 5, 5, 6, 7, 38. Does it raise or lower the mean? |
| 4 | A graph has no axis labels. What can a reader not tell? |
Show answer
1. A bar graph. Favourite sport is categorical. 2. A time-series graph, because it is one measurement repeated over time. 3. 38. It is far above the rest, so it drags the mean up: the other five run 4 to 7, but the mean of all six is 10.8. 4. What is being measured, and in what units. The shape of the graph tells you nothing without them.
The answers
- Favourite sport is categorical, so a bar graph.
- Temperature over a fortnight is a time series.
- 38 is the outlier and it raises the mean to 10.8.
| Answer | |
|---|---|
| 1 | bar graph |
| 2 | time-series graph |
| 3 | 38; it raises the mean |
| 4 | what is measured, and in what units |
What to take away
- The data type chooses the graph, not you.
- Stacked for totals, clustered to compare the parts.
- An outlier is usually real. Explain it, do not delete it.
| Remember | |
|---|---|
| The data type | chooses the graph; you do not |
| Categories | bar graph. Measurements: dot plot |
| Over time | time-series graph |
| Stacked or clustered | total at a glance, or compare the parts |
| An outlier | is usually real: explain it, do not delete it |
Is your child on track?
Take the free placement test