Reading graphs, shape and skew
What this lesson covers
- The response to a statistical question includes findings that are summarised and interpreted in context and using evidence.
- The tapering sides of a data visualisation are known as tails and may taper at the same rate, producing a symmetrical shape, or an uneven rate, producing a skewed shape.
- Interpreting a data visualisation includes describing its variables and their units, the context for the data, and the visualisation's key features.
- A graph that is missing parts (e.g. title, axis labels, axis scales) or has errors may have been made to be misleading or to hide information.
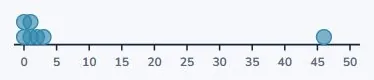
What does this graph tell you?
- You can see one value is much bigger than the rest.
- And that is genuinely all you can say.
- Bigger what? Of whom? Measured in what?
What reading a graph actually means
- Name the variable and its units.
- Say who the data came from, and when.
- Then point at what stands out.
| Say | Meaning | Here |
|---|---|---|
| The variable | what was measured | rainfall |
| The units | in what | millimetres |
| Who or where | the context | one town, one week |
| Key features | what stands out | one very wet day |
Now the same graph means something
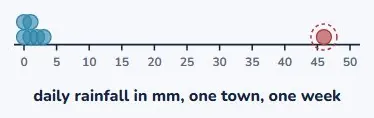
- Daily rainfall in millimetres, one town, one week.
- Six days near zero and one at 46.
- Same dots. Completely different amount of information.
Look at the shape before anything else
- The sides of a data set are called its tails.
- If both taper the same, it is symmetrical.
- If one runs on much further, it is skewed.
| Shape | Tails | Averages |
|---|---|---|
| Symmetrical | both tails taper the same | mean ≈ median |
| Skewed right | a long tail to the right | mean above median |
| Skewed left | a long tail to the left | mean below median |
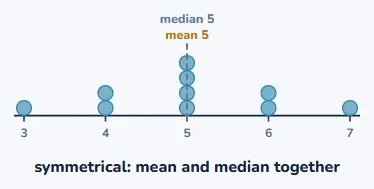
A symmetrical set
- It falls away at the same rate on both sides.
- The mean and the median land in the same place.
- Both are 5. Either one describes it fairly.
A skewed set
- Most values are low, with a long tail running right.
- The median is 3.5. The mean is 4.65.
- The tail has dragged the mean towards it.
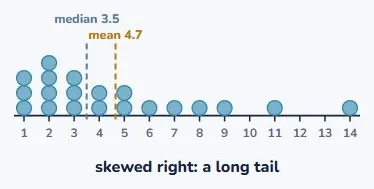
The tail tells you which way
- Tail to the right: the mean sits above the median.
- Tail to the left: the mean sits below it.
- You can say that by eye, before calculating.
| Set | Mean | Median |
|---|---|---|
| Symmetrical set | mean 5 | median 5 |
| Right-skewed set | mean 4.65 | median 3.5 |
| The gap | the tail pulled the mean | +1.15 |
So which average do you report?
- Symmetrical: either. They agree.
- Skewed: the median is the honest one.
- Or report both and say why they differ.
| Shape | Tails | Averages |
|---|---|---|
| Symmetrical | both tails taper the same | mean ≈ median |
| Skewed right | a long tail to the right | mean above median |
| Skewed left | a long tail to the left | mean below median |
The range is the fragile one
- It is worked out from the two most extreme values.
- And from nothing else at all.
- So one outlier controls it completely.
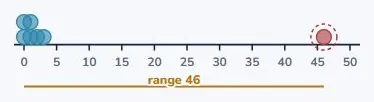
Range 46, on a week that mostly spanned 3
- Six days between 0 and 3 mm.
- The range says 46.
- That is a fact about Friday, not about the week.
| Data | Working | Spread |
|---|---|---|
| Six ordinary days | span 0 to 3 mm | spread 3 |
| Add the storm | range is 46 − 0 | spread 46 |
| So the range | describes one day | not the week |
What to do about it
- Do not delete the outlier. Say what it is doing.
- "The range is 46, but that is one storm."
- "The other six days spanned only 3 mm."
| Data | Working | Spread |
|---|---|---|
| Six ordinary days | span 0 to 3 mm | spread 3 |
| Add the storm | range is 46 − 0 | spread 46 |
| So the range | describes one day | not the week |
A finished answer is a sentence
- Not a circled number.
- Say what was measured, of whom, and what you found.
- And quote the numbers as your evidence.
| Part | Here | |
|---|---|---|
| What | daily rainfall in millimetres | |
| Who and when | one town, one week | |
| Evidence | median 1 mm, mean 7.6 mm | |
| The finding | six dry days and one storm |
Writing it out
- "Most days that week were nearly dry."
- "The median rainfall was 1 mm."
- "One storm on Friday brought 46, lifting the mean to 7.6."
| Part | Here | |
|---|---|---|
| What | daily rainfall in millimetres | |
| Who and when | one town, one week | |
| Evidence | median 1 mm, mean 7.6 mm | |
| The finding | six dry days and one storm |
Graphs in the news
- The same rules apply, and they get broken more often.
- Check the axis. Check the units. Check the source.
- A graph with pieces missing may be missing them on purpose.
| Missing | So you cannot tell |
|---|---|
| No axis numbers | you cannot tell how big anything is |
| No units | millimetres or metres: no way to know |
| Axis not from zero | small differences look enormous |
| No title | you do not know what it is about |
| No source | you do not know who was asked |
The axis that does not start at zero
- On a time-series graph that is often the right choice.
- On a bar graph comparing amounts, it is not.
- It makes a small gap look like a huge one.
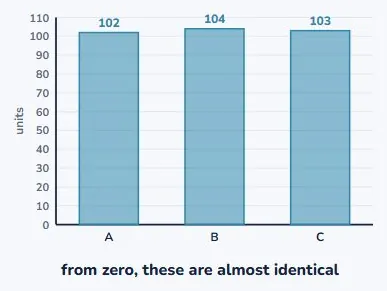
Sometimes the honest answer is "I cannot tell"
- If the units are missing, you cannot tell.
- If the source is missing, you cannot tell who it is about.
- Saying so is a correct answer, not a failure.
| Missing | So you cannot tell |
|---|---|
| No axis numbers | you cannot tell how big anything is |
| No units | millimetres or metres: no way to know |
| Axis not from zero | small differences look enormous |
| No title | you do not know what it is about |
| No source | you do not know who was asked |
Your turn: four questions
- Pause here and try all four.
- Question 4 wants an actual sentence, written out.
- Include the numbers as evidence.
| Question | |
|---|---|
| 1 | A dot plot has a long tail to the right. Mean bigger or smaller than median? |
| 2 | A bar graph has no numbers on its vertical axis. What can you not tell? |
| 3 | Find the range of 5, 6, 6, 7, 8, 45. Is it a fair measure of spread? |
| 4 | Write one sentence reporting: median 1 mm, mean 7.6 mm, one day of 46 mm. |
Show answer
1. Bigger. The tail drags the mean towards it, and the median barely moves. 2. How big anything is, or how big the differences between the bars are. You can see which is tallest and nothing more. 3. 40. It is not fair: 45 is an outlier, and without it the range is only 3. Report both, or say the spread is about 3 with one exceptional value. 4. Something like: "Most days that week were nearly dry (the median was 1 mm), but a single storm on Friday brought 46 mm, which lifted the mean to 7.6 mm."
The answers
- A right tail pulls the mean above the median.
- With no axis numbers you cannot tell how big anything is.
- The range is 40, and it is not fair: without the 45 it is 3.
| Answer | |
|---|---|
| 1 | bigger: the tail drags the mean |
| 2 | how big anything is |
| 3 | 40, and not fair: without the outlier it is 3 |
| 4 | a sentence with the numbers in it as evidence |
What to take away
- Look at the shape first; it decides which average is honest.
- A tail to the right pulls the mean above the median.
- Finish with a sentence, and put the numbers in it.
| Remember | |
|---|---|
| A finished answer | is a sentence, with evidence |
| Look at the shape first | it decides which average is honest |
| A tail to the right | pulls the mean above the median |
| The range | is the measure an outlier ruins |
| A graph missing labels | cannot be interpreted at all |
Is your child on track?
Take the free placement test