Mean, median, mode and range
What this lesson covers
- A variable is an attribute or measurement of the people or objects being studied. A categorical variable classifies objects or individuals into groups. Discrete numerical variables are counted. Continuous numerical variables are measured.
- The response to a statistical question can be summarised by a measure of central tendency. The mean is the average of numerical data. The median is the middle value for sorted numerical data. The mode is the data value with the highest frequency for categorical data or discrete numerical data.
- The response to a statistical question can be summarised by the range as a measure of spread. The range for numerical data is the highest value minus the lowest value.
Are our feet the same length?
- That is a real question, and you cannot answer it by thinking.
- You have to go and measure some feet.
- Then you have to say something honest about the numbers.
| Step | |
|---|---|
| 1. Ask a question | |
| 2. Collect data that could answer it | |
| 3. Summarise it | |
| 4. Answer the question |
What you measure is the variable
- A variable is the thing you record about each person.
- Foot length. Eye colour. Number of siblings.
- They are not all the same kind of thing.
| Variable | Because | Kind |
|---|---|---|
| Eye colour | sorts into groups | categorical |
| Number of siblings | counted | discrete numerical |
| Foot length | measured | continuous numerical |
| Favourite sport | sorts into groups | categorical |
Categorical sorts into groups
- Eye colour puts each person into a group.
- Blue, brown, green. There is no arithmetic to do.
- You cannot find the average eye colour of a class.
| Variable | Because | Kind |
|---|---|---|
| Eye colour | sorts into groups | categorical |
| Number of siblings | counted | discrete numerical |
| Foot length | measured | continuous numerical |
| Favourite sport | sorts into groups | categorical |
And numerical splits two ways
- Counted things are discrete. Measured things are continuous.
- The test: could it sensibly be a half?
- Not half a sibling. But 24.5 centimetres is fine.
| Question | Answer | Means |
|---|---|---|
| Can it be a half? | No | counted, so discrete |
| Yes | measured, so continuous | |
| Siblings | no half siblings here | discrete |
| Foot length | 24.5 cm is fine | continuous |
So: six people, feet measured
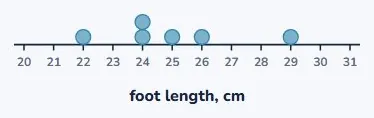
- 22, 24, 24, 25, 26 and 29 centimetres.
- Continuous numerical data, because we measured it.
- Already sorted, which saves a step later.
The mean: share it out evenly
- Add every value: 150.
- Divide by how many there are: 150 ÷ 6.
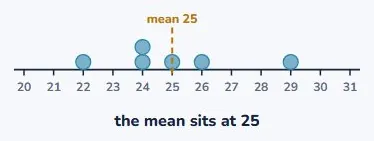
- 25 centimetres. That is the mean.
| Step | Working | Gives |
|---|---|---|
| Add them all | 22+24+24+25+26+29 | 150 |
| Divide by how many | 150 ÷ 6 | 25 |
| Mean | 25 cm |
It is the balancing point
- Put the mean on the plot and look at it.
- The values below it balance the values above it.
- Which is why one very large value drags it upwards.
The median: the middle one
- Sort the data first. Always. Otherwise this is meaningless.
- Six values, so there is no single one in the middle.
- Take the middle two, 24 and 25, and go halfway: 24.5.
| Step | Working | Gives |
|---|---|---|
| Sort them first | 22, 24, 24, 25, 26, 29 | |
| Six values | no single middle one | |
| Take the middle two | 24 and 25 | |
| Halfway between | (24 + 25) ÷ 2 | 24.5 cm |
Odd is easier than even
- Five values: the third one is the middle. Done.
- Four values: the middle two, averaged.
- 3, 5, 8, 10 gives (5 + 8) ÷ 2, which is 6.5.
| How many | Middle | Median |
|---|---|---|
| Odd, say 5 | the 3rd value | that value |
| Even, say 6 | the 3rd and 4th | halfway between |
| 3, 5, 8, 10 | 5 and 8 | 6.5 |
The mode: the most common
- Which value turns up most often?
- 24 appears twice, everything else once.
- So the mode is 24 centimetres.
| Step | Working | Gives |
|---|---|---|
| Which value repeats? | 24 appears twice | |
| Everything else | appears once | |
| Mode | 24 cm |
And the range is not an average at all
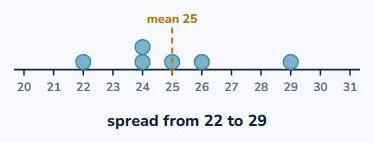
- Highest minus lowest. 29 − 22 = 7 centimetres.
- It does not tell you where the data sits.
- It tells you how spread out it is. Different question.
| Step | Working | Gives |
|---|---|---|
| Highest | 29 cm | |
| Lowest | 22 cm | |
| Range | 29 − 22 | 7 cm |
Three centres, three answers
- Mean 25. Median 24.5. Mode 24.
- All three are correct. They disagree.
- So "the average foot is 25 cm" needs saying which one you used.
| Measure | Value | What it is |
|---|---|---|
| Mean | 25 cm | the balancing point |
| Median | 24.5 cm | the middle one |
| Mode | 24 cm | the most common |
| Range | 7 cm | how spread out |
Back to the question we asked
- Are our feet the same length? No.
- They differ by up to 7 centimetres, which is the range.
- The centre tells you the typical foot. The range answers this.
One honest warning about the mode
- Our 24 repeated because we rounded to whole centimetres.
- Measure to the millimetre and probably nothing repeats at all.
- On measured data the mode is often useless.
| Data | Mode is | |
|---|---|---|
| Eye colour | the only option | essential |
| Number of siblings | sensible | useful |
| Foot length to the mm | probably nothing repeats | useless |
So which one should you use?
- Categorical data leaves you only the mode.
- If a few values are extreme, the median resists them better.
- And if you want spread rather than centre, use the range.
| Situation | Because | Use |
|---|---|---|
| Categorical data | mean and median impossible | mode |
| Measured data | mode often meaningless | mean or median |
| A few extreme values | mean gets dragged | median |
| Spread | none of the three | range |
Your turn: three questions
- The data is 5, 8, 8, 11 and 13. Pause here.
- Five values, so the median is straightforward.
- Label your answers. Two of them come out the same number.
| Question | |
|---|---|
| The data: 5, 8, 8, 11, 13 | |
| 1 | Find the mean. |
| 2 | Find the median. |
| 3 | Find the mode and the range. |
Show answer
1. 9. They add to 45, and 45 ÷ 5 = 9. 2. 8. Five values, so the middle one is the third, and they are already sorted. 3. Mode 8, the only repeated value. Range 13 − 5 = 8. Note the mode and the range are both 8 here and mean completely different things, which is a good reason to label your answers.
The answers
- They add to 45, so the mean is 9.
- The median is the third value, which is 8.
- The mode is 8 too. And the range is 13 − 5, which is also 8.
| Answer | |
|---|---|
| Mean | 9 |
| Median | 8 |
| Mode | 8 |
| Range | 8 |
What to take away
- Start with a question. The arithmetic is there to answer it.
- Mean, median and mode are three answers and they disagree.
- The range is spread, not centre. Say which one you used.
| Remember | |
|---|---|
| Start with a question | not with the arithmetic |
| Counted or measured | tells discrete from continuous |
| Mean | add them all, divide by how many |
| Median | sort first, then take the middle |
| Range | highest minus lowest, a spread not a centre |
Is your child on track?
Take the free placement test