Choosing a graph, and spotting outliers
What this lesson covers
- Categorical data can be visualised through dot plots and bar graphs.
- Paired categorical variables can be visualised through a stacked bar graph or a clustered bar graph.
- Bivariate time-series data can be visualised through a time-series graph.
- A good data visualisation should allow viewers to discern the variable or variables and who the data was collected from, and then additional information such as units, frequency, proportions, patterns, and trends.
- Outliers are individual data points that are very much bigger or smaller than most of the data points.
- Outliers skew the mean value for a data set towards themselves, but not the median value.
- Outliers are not necessarily an error, as there are some events that occur rarely in many situations.
A graph is an argument, not a decoration
- You draw one so a reader can see something at a glance.
- Which means the reader has to be able to tell what it shows.
- Get that wrong and the graph is worse than the table was.
| The reader must see | Which is | From the |
|---|---|---|
| What was measured | the variable | axis label |
| Who it came from | the group studied | title |
| In what units | for numerical data | axis label |
| How much of it | the frequency | the scale |
Which is why labels are not optional
- A graph with no title: who is this data about?
- No axis label: what was measured, and in what?
- No scale: is that bar twice the other, or barely bigger?
| Missing | You cannot tell | |
|---|---|---|
| Title | who was studied | |
| Axis label | what was measured | |
| Units | whether it is cm or m | |
| Scale | how big the differences are |
And a missing label can be deliberate
- A bar chart starting at 90 instead of 0 exaggerates everything.
- Sometimes that is carelessness. Sometimes it is not.
- If you cannot check a graph, do not trust its conclusion.
| Trick | Effect | |
|---|---|---|
| Axis not starting at 0 | small differences look huge | |
| No scale at all | nothing can be checked | |
| No sample size | you cannot judge the evidence |
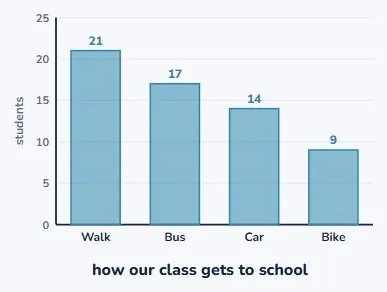
Categorical data gets a bar graph
- Favourite sport, eye colour, how you get to school.
- One bar per category, height is how many.
- The bars can go in any order, because the groups do not.
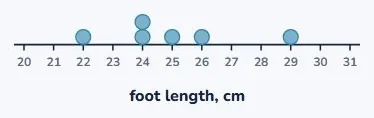
A few numerical values get a dot plot
- One dot per measurement, stacked where they repeat.
- You can see every individual value, which a bar graph hides.
- Best when there are not too many of them.
The data chooses, not you
- Look at what kind of variable you have first.
- Categorical, numerical, two variables, or something over time.
- Each one has a chart that fits it. Pick that one.
| Data | Example | Chart |
|---|---|---|
| Categorical | favourite sport | bar graph |
| A few numerical values | foot lengths of 6 people | dot plot |
| Two categorical at once | year group and transport | clustered or stacked |
| Something over time | temperature each month | time-series graph |
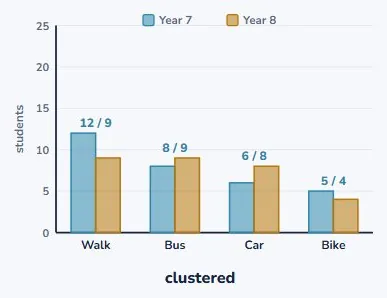
Two categories at once: clustered
- Now split each group by year level as well.
- Two bars per category, side by side.
- You can compare Year 7 against Year 8 directly.
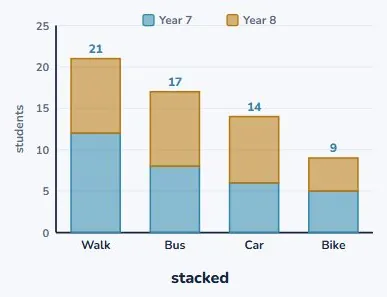
The same data, stacked
- Now put the two on top of each other instead.
- The bar height is the total for that category.
- Walking is clearly the biggest overall. That was hidden before.
So they answer different questions
- Clustered compares the two parts against each other.
- Stacked shows the total for each category.
- Neither is better. Ask what your question was.
| Chart | What it does | Good for |
|---|---|---|
| Clustered | bars side by side | compares the parts |
| Stacked | bars on top of each other | shows the total |
| Same data | different question answered |
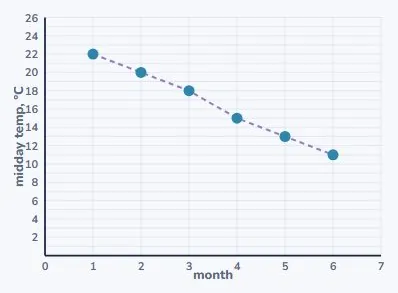
And things over time get a line
- Time goes along the bottom, always.
- Join the points, because the order means something.
- That is a time-series graph, and it shows trends.
Why you join those and not the bars
- Months come in an order, and there is time between them.
- The line says something happened between the points.
- Categories have no order, so joining them would be nonsense.
| Data | Ordered? | Join the points? |
|---|---|---|
| Months | yes | yes |
| Favourite sport | no | no |
| Foot lengths | not a sequence | no |
Now: a value that does not belong
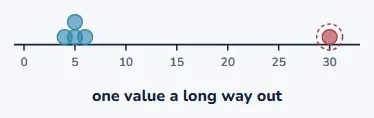
- Take 4, 5, 5, 6 and 5. Nothing surprising there.
- Change the last one to 30 and look at the plot.
- That is an outlier: far bigger than everything else.
It drags the mean with it
- Before: the five values added to 25, so the mean was 5.
- After: they add to 50, so the mean is 10.
- One value changed, and the mean doubled.
| Data | Mean | Median |
|---|---|---|
| 4, 5, 5, 6, 5 | mean 5 | median 5 |
| 4, 5, 5, 6, 30 | mean 10 | median 5 |
But the median does not move
- Sorted, the middle value was 5 before.
- Sorted, the middle value is 5 after.
- Exactly the same. The median never noticed.
| Data | Mean | Median |
|---|---|---|
| 4, 5, 5, 6, 5 | mean 5 | median 5 |
| 4, 5, 5, 6, 30 | mean 10 | median 5 |
| The mean | doubled | |
| The median | did not move |
Because of what each one uses
- The mean adds every value, so a huge one pulls hard.
- The median only cares which value sits in the middle.
- Change the 30 to 300 and the median is still 5.
| Measure | Uses | So |
|---|---|---|
| The mean | uses every value | so a big one drags it |
| The median | only uses position | so size does not matter |
| Change 30 to 300 | mean moves again | median still 5 |
And an outlier is not automatically wrong
- Check it. It might be a typo, or a mis-measurement.
- But rare things do happen, and then it is real data.
- If it is real, keep it and say so. Never quietly delete it.
| Step | ||
|---|---|---|
| Check it | is it a typo or a mis-measurement? | |
| If it is real | keep it, and say so | |
| Report both | mean and median, when they disagree | |
| Never | quietly delete it |
Your turn: four questions
- Pause here and try all four.
- Question 2 wants a number and an effect, not just the number.
- Question 4 turns on what is being compared.
| Question | |
|---|---|
| 1 | Which graph suits the favourite sport of 30 students? |
| 2 | In 4, 5, 5, 6, 30, name the outlier and its effect. |
| 3 | Name three things every graph must have. |
| 4 | Clustered or stacked, to compare Year 7 with Year 8 directly? |
Show answer
1. A bar graph. Favourite sport is categorical, so there is nothing to measure along an axis. 2. 30. It doubles the mean from 5 to 10 and leaves the median at 5. 3. A title saying who the data is about, labels on both axes including units, and a scale. 4. Clustered. The bars sit side by side, so you compare the two year groups directly. Stacked would show you each total instead.
The answers
- Favourite sport is categorical, so a bar graph.
- 30 is the outlier. It doubles the mean and leaves the median.
- Title, axis labels with units, and a scale. And clustered.
| Answer | |
|---|---|
| 1 | bar graph |
| 2 | 30, mean 5 to 10 |
| 3 | title, labels, scale |
| 4 | clustered |
What to take away
- Look at the data first. It decides which graph you draw.
- An outlier drags the mean and leaves the median where it was.
- And it is not automatically an error, so never just delete it.
| Remember | |
|---|---|
| The data | chooses the graph, not your drawing speed |
| Every graph | needs a title, axis labels and a scale |
| Clustered | compares parts; stacked shows totals |
| An outlier | drags the mean and leaves the median alone |
| And it is | not automatically an error |
Is your child on track?
Take the free placement test