Reading a graph properly: shape, centre and spread
What this lesson covers
- The response to a statistical question includes findings that are summarised and interpreted in context and using evidence.
- The tapering sides of a data visualisation are known as tails and may taper at the same rate, producing a symmetrical shape, or an uneven rate, producing a skewed shape. In positively skewed data, the right-tail tapers more slowly than the left tail. In negatively skewed data, the left tail tapers more slowly than the right tail.
- Interpreting a data visualisation includes describing its variables and their units, the context for the data, and the visualisation's key features: its shape, its central tendency, its spread, and other features.
- A graph that is missing parts (e.g. title, axis labels, axis scales) or has errors may have been made to be misleading or to hide information.
Two different jobs
- "The median is 24.5." That is a summary. It is a number.
- "A typical foot is about 24.5 centimetres." That is an interpretation.
- Same fact. Only the second one says anything.
| Job | Looks like | Produces |
|---|---|---|
| Summarising | the median is 24.5 | a number |
| Interpreting | a typical foot is about 24.5 cm | a sentence |
| The outcome | asks for the second |
What to say about any graph
- What was measured, in what units, and who from.
- Then the shape, the centre and the spread.
- Work through that list and you have an interpretation.
| Ask | Which is | |
|---|---|---|
| What | the variable, and its units | |
| Who | who the data came from | |
| Shape | symmetrical, or skewed which way | |
| Centre | where the typical value sits | |
| Spread | how far it runs, and any outliers |
In context means with the noun attached
- "The range is 7" is not a finding. Seven what?
- "Foot lengths vary by up to 7 cm across our class" is.
- Units and context, every time, or it does not count.
| Written | Verdict | |
|---|---|---|
| The range is 7 | no units, no context | not a finding |
| The mean is 25 | the mean of what? | not a finding |
| Feet vary by up to 7 cm | says what and how much | a finding |
Now the shape of the data
- Plot it and the dots make a shape.
- The thin ends are called the tails.
- How those tails taper is what you describe.
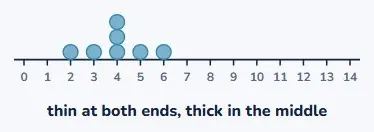
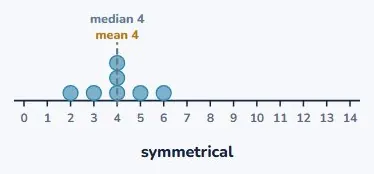
Both tails the same: symmetrical
- Fold it down the middle and the halves match.
- 2, 3, 4, 4, 4, 5, 6. One peak, even sides.
- Mean 4, median 4. They agree, which is the giveaway.
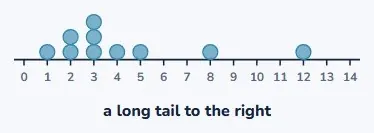
One tail longer: skewed
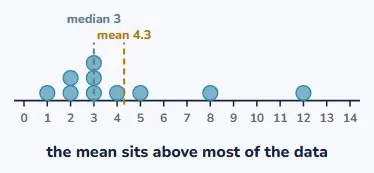
- Now 1, 2, 2, 3, 3, 3, 4, 5, 8, 12.
- Most of it is bunched low, with a few stragglers high up.
- The right tail tapers slowly. This is positive skew.
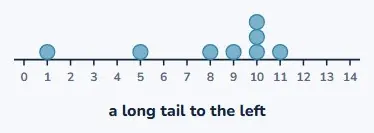
And the other way round
- 1, 5, 8, 9, 10, 10, 10, 11. Bunched high this time.
- The long tail runs off to the left.
- Left tail tapers slowly, so this is negative skew.
The name comes from the tail
- Positive skew has most of its values on the LEFT.
- That feels backwards, and it catches almost everybody.
- Name it from where the tail points, never from the bulk.
| Feature | Where | Name |
|---|---|---|
| Most values | on the left | |
| Long tail | to the right | |
| Named after | the tail, never the bulk | positive skew |
You can check it with arithmetic
- A long right tail drags the mean up but not the median.
- So mean above median means skewed right.
- Mean below median means skewed left. Same idea as an outlier.
| Data | Summaries | Shape |
|---|---|---|
| 2,3,4,4,4,5,6 | mean 4, median 4 | symmetrical |
| 1,2,2,3,3,3,4,5,8,12 | mean 4.3, median 3 | positive skew |
| 1,5,8,9,10,10,10,11 | mean 8, median 9.5 | negative skew |
Which centre to report, then
- On our skewed set, the mean is 4.3 and the median is 3.
- But 4.3 is bigger than seven of the ten values.
- So the median describes a typical value better. Use it.
Then the spread
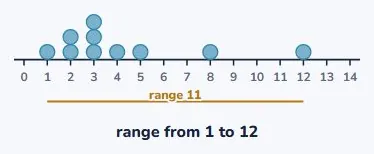
- The range is the highest value minus the lowest.
- For the skewed set that is 12 − 1, which is 11.
- But look at how it was built: only two values decided it.
Which makes it fragile
- Take 3, 4, 4, 5 and 40. The range is 37.
- Drop the 40 and the range is 2.
- So 37 is describing the outlier, not the rest of the data.
| Data | Working | Range |
|---|---|---|
| 3, 4, 4, 5, 40 | range 40 − 3 | 37 |
| Without the 40 | range 5 − 3 | 2 |
| So the range | describes the outlier | not the data |
So say what you saw
- Spot outliers by eye before you quote a range.
- Then say: the range is 37, but one value is far out.
- Most of the data runs from 3 to 5. Both facts, honestly.
| Report | Verdict | |
|---|---|---|
| The range is 37 | true and misleading | incomplete |
| Most run 3 to 5, one is 40 | both facts | honest |
Sometimes you cannot interpret at all
- No scale on the axis? The bars cannot be compared.
- No units? The numbers do not mean anything.
- No sample size? You cannot weigh the evidence.
| Missing | Consequence | |
|---|---|---|
| No scale on the axis | bars cannot be compared | |
| No units | the numbers mean nothing | |
| No sample size | you cannot judge the evidence | |
| Axis not from zero | differences are exaggerated |
And saying so is the right answer
- Students treat "I cannot tell" as failing to answer.
- It is not. Name what is missing and why it matters.
- That is a full answer, and it is the honest one.
| Response | Verdict | |
|---|---|---|
| Guessing anyway | invents information | wrong |
| "There is no scale, so the bars cannot be compared" | names the gap | right |
Which is worth doing outside class
- Graphs turn up in the news constantly.
- Run the same checks: units, scale, who was asked, how many.
- A graph that will not survive those questions is not evidence.
| Ask | Which is | |
|---|---|---|
| What | the variable, and its units | |
| Who | who the data came from | |
| Shape | symmetrical, or skewed which way | |
| Centre | where the typical value sits | |
| Spread | how far it runs, and any outliers |
Your turn: three questions
- The data is 1, 2, 2, 3, 3, 3, 4, 5, 8, 12. Pause here.
- Question 1 wants a direction, so check which way the tail runs.
- Question 3 has a short honest answer.
| Question | |
|---|---|
| The data: 1, 2, 2, 3, 3, 3, 4, 5, 8, 12 | |
| 1 | Describe its shape. |
| 2 | Mean 4.3, median 3. Which summarises it better, and why? |
| 3 | A bar graph has no scale on its vertical axis. What can you say? |
Show answer
1. Positively skewed. Most values are bunched at the low end and there is a long tail running right to 12. 2. The median, 3. The mean of 4.3 is above almost every value in the set, because the 8 and the 12 have pulled it up. 3. Very little. You can see which bar is tallest, and nothing about by how much. A graph with no scale cannot be interpreted, and saying so is the correct answer rather than a refusal to answer.
The answers
- Positively skewed: bunched low, long tail out to 12.
- The median, 3. The mean of 4.3 is above seven of the ten values.
- And with no scale, you can say which bar is tallest and no more.
| Answer | |
|---|---|
| 1 | positively skewed |
| 2 | the median, 3 |
| 3 | it cannot be interpreted |
What to take away
- A number is a summary. A sentence with units is a finding.
- Skew is named after the tail, never after where the bulk sits.
- And a graph you cannot check is a graph you should not believe.
| Remember | |
|---|---|
| Summarise then interpret | a number, then a sentence |
| Say the shape | symmetrical, or skewed which way |
| Skew is named | after the tail, not the bulk |
| Mean above median | means a tail to the right |
| A range | is built from the two most extreme values |
Is your child on track?
Take the free placement test