Position-time graphs, free-body diagrams and pressure
What this lesson covers
- A bigger net force gives a bigger change in speed in the same time
- Position-time graphs: flat, straight, steep and curved lines
- Finding speed from the slope of a position-time graph
- Free-body diagrams and the net force from them
- Pressure uses the force at right angles to a surface
- Smaller area, bigger pressure, and how everyday objects use this
Building on part 1
- Part 1 showed that an unbalanced force changes motion, and that pressure is force divided by area.
- This part asks how much the motion changes, how to show motion on a graph, and why the area a force acts on matters so much.
A bigger push gives a bigger change
- Push a trolley gently for two seconds and it gains a little speed. Push it twice as hard for the same two seconds and it gains about twice as much speed.
- The rate at which speed changes is called acceleration, measured in metres per second per second (m/s²).
- For the same object, acceleration is proportional to the net force: double the force, double the acceleration.
- A heavier object needs a bigger force for the same acceleration, which is why a full trolley is harder to get moving than an empty one.
- Newton put this as F = m × a: net force (N) = mass (kg) × acceleration (m/s²).
Same trolley, two different pushes
- A loaded trolley has a mass of 20 kg. Find its acceleration with a net force of 40 N, then with 80 N, and say how much speed it gains in 3 s each time.
- a = F ÷ m = 40 N ÷ 20 kg = 2 m/s²rearrange F = m × a
- Speed gained in 3 s = 2 × 3 = 6 m/sgains 2 m/s every second
- a = 80 N ÷ 20 kg = 4 m/s²double the force
- Speed gained in 3 s = 4 × 3 = 12 m/sgains 4 m/s every second
- Double the net force, double the speed gained in the same time
Position-time graphs
- A position-time (x-t) graph has time along the bottom axis and position, the distance from a starting point, up the side.
- Each point says where the object was at that moment, and the shape of the line tells the story of the motion.
- The slope of the line is the speed: speed = change in position ÷ change in time.
- Always read the axis labels and units before reading the line.
| Shape of the line | Meaning |
|---|---|
| Flat (horizontal) | Position not changing: the object is stopped |
| Straight and sloping | Steady (constant) speed |
| Straight and steeper | A faster steady speed |
| Straight and gentler | A slower steady speed |
| Curving, getting steeper | Speeding up (accelerating) |
| Curving, getting flatter | Slowing down |
Reading a cycle ride from its graph
- A cyclist's position along a Hamilton cycle path is recorded. Joined up, the points make three straight sections.
- Find the speed in each section and describe the ride.
| Time (s) | 0 | 10 | 20 | 30 |
|---|---|---|---|---|
| Position (m) | 0 | 50 | 50 | 150 |
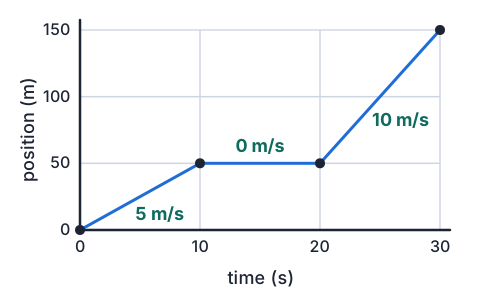
- 0 to 10 s: (50 − 0) m ÷ 10 s = 5 m/sstraight sloping line
- 10 to 20 s: (50 − 50) m ÷ 10 s = 0 m/sflat line, stopped
- 20 to 30 s: (150 − 50) m ÷ 10 s = 10 m/ssteeper straight line
- Steady 5 m/s, stops for 10 s, then a faster steady 10 m/s
A curved line means changing speed
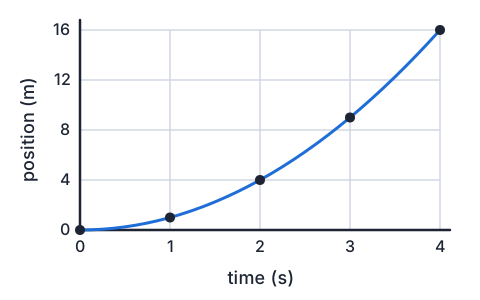
- A ball rolls from rest down a long ramp. Its position each second is in the table.
- The distance covered each second grows: 1 m, then 3 m, then 5 m, then 7 m.
- Plotted, the points do not sit on a straight line. They form a curve that gets steeper, showing the ball is speeding up.
- A ball rolling to a stop on grass makes the opposite shape: a curve that flattens until it is horizontal.
| Time (s) | 0 | 1 | 2 | 3 | 4 |
|---|---|---|---|---|---|
| Position (m) | 0 | 1 | 4 | 9 | 16 |
| Distance in that second (m) | 1 | 3 | 5 | 7 |
Free-body diagrams
- A free-body diagram shows one object as a box or a dot, with an arrow for every force acting on it.
- Each arrow starts on the object, points the way the force acts, is drawn to length by size, and is labelled with its name and value.
- Only forces on the object go in, not forces the object puts on other things.
- To find the net force, combine the up and down arrows, then the left and right arrows, separately.
- Common forces: weight (gravity pulling down), the support or normal force (a surface pushing up), friction, air resistance, thrust or a push.
Net force from a free-body diagram
- A box of feijoas is pushed across a shed floor. The diagram has four arrows, listed in the table.
- Find the net force and say how the box moves.
| Force | Direction | Size |
|---|---|---|
| Weight | Down | 100 N |
| Support from the floor | Up | 100 N |
| Push | Right | 30 N |
| Friction | Left | 12 N |
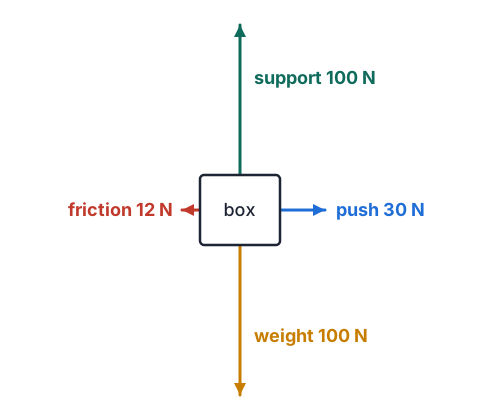
- Vertical: 100 N up − 100 N down = 0 Nbalanced, so the box does not rise or sink
- Horizontal: 30 N right − 12 N left = 18 N rightunbalanced
- Net force 18 N to the right: the box speeds up to the right
Pressure counts the force pushing straight into a surface
- To find pressure, take only the part of the force that pushes at right angles (perpendicular) into the surface, and divide it by the contact area.
- Your weight presses straight down into level ground, so all of it counts.
- A force sliding along a surface, like a hand wiping a bench, does not press into it, so it adds no pressure.
- Units are the same as in part 1: newtons, square metres, pascals.
Same force, different area
- For a fixed force, pressure and area work against each other: halve the area and the pressure doubles.
- An axe and a hammer swung with the same force show this. The axe's thin edge touches the wood over a tiny area, so the pressure is huge and the wood splits.
- The hammer's flat face spreads the same force over a bigger area, so it drives a nail without cutting.
- The nail itself works the other way round: the hammer hits a broad head, and the force comes out at a sharp point.
| Tool, 300 N force | Contact area | Pressure |
|---|---|---|
| Axe edge | 1 cm² = 0.0001 m² | 300 ÷ 0.0001 = 3 000 000 Pa |
| Hammer face | 6 cm² = 0.0006 m² | 300 ÷ 0.0006 = 500 000 Pa |
Why skiers do not sink on Ruapehu
- A skier weighs 700 N. Compare the pressure on the snow in boots, on one ski, and on two skis.
- Boots: 0.05 m² in total. One ski: 0.15 m². Two skis: 0.30 m².
- Boots: 700 N ÷ 0.05 m² = 14 000 Pasmall area, high pressure: boots sink
- One ski: 700 N ÷ 0.15 m² ≈ 4700 Pathree times the area of the boots
- Two skis: 700 N ÷ 0.30 m² ≈ 2300 Padouble the area again
- Two skis give about a sixth of the boot pressure, so the skier stays on top
Matching area to the job
- When an object needs to cut or pierce, it is designed with a small contact area for high pressure.
- When it needs to stay on top of a soft surface or avoid damage, it is given a large area for low pressure.
- A Waikato farm tractor has wide tyres so its weight is spread out, which stops it sinking in a wet paddock and squashing the soil.
- A road bike can use narrow tyres because hard tarseal does not sink, so there is no need to spread the weight.
| Object | Contact area | Why |
|---|---|---|
| Knife, axe, drawing pin | Very small | High pressure to cut or pierce |
| Tractor tyres, snowshoes, two skis | Large | Low pressure so they do not sink |
| Backpack straps | Wide | Lower pressure on the shoulders, so it hurts less |
| Stiletto heel | Tiny | High enough pressure to dent a wooden floor |
Common mistakes
- A flat line on a position-time graph means the object is moving at a steady speed.A flat line means the position is not changing, so the object is stopped; a straight sloping line is a steady speed.
- A straight line sloping upwards means the object is speeding up.A straight line has the same slope all the way, so the speed is steady; only a curve that gets steeper shows speeding up.
- The free-body diagram of a box should show the box pushing down on the floor.A free-body diagram shows only the forces acting on the box, such as its weight and the floor's support, not forces it puts on other things.
- An axe cuts wood because it pushes harder than a hammer.With the same force, the axe's thin edge has a much smaller area, so the pressure F ÷ A is far bigger.
Same push, different area
You need: kitchen scales, a lump of play dough or plasticine about 3 cm thick, a pencil, a 50c coin, a ruler
- Put the dough on the scales and set them to zero.
- Press the flat, unsharpened end of the pencil straight down into the dough until the scales read 500 g, which is a force of about 5 N, then lift it off.
- In a fresh spot, press the flat face of the coin straight down until the scales again read 500 g, then lift it off.
- Measure across the pencil end and the coin, work out each contact area in m², and calculate each pressure with P = F ÷ A.
- Look for a deep dent from the pencil and only a faint mark from the coin: the force was the same, but the pencil end's area is about ten times smaller, so its pressure is about ten times bigger.
Safety: Press gently and stay well under the scales' limit, because a glass-topped kitchen scale can crack under a hard push, and use the blunt end of the pencil, never the sharp tip.
Your turn
- 1. On a position-time graph, a line goes from 0 m at 0 s to 120 m at 20 s in a straight line. What is the speed, and is it steady?
- 2. Describe the motion shown by a position-time graph that is flat from 5 s to 12 s.
- 3. A kayak has 150 N of paddle thrust forward and 90 N of drag backward; its weight and the water's upward push are both 800 N. Find the net force.
- 4. A 60 N force pushes a drawing pin with a point of 0.000 001 m². What pressure does the point make, and why does it go into a cork board?
- 5. Explain why one wide snowboard and two skis both work on soft snow, but walking in boots does not.
Show answer
1. 6 m/s, from 120 ÷ 20, and it is steady because the line is straight. 2. The object is stopped (stationary) for 7 s, because its position does not change. 3. Vertical forces cancel, so the net force is 150 − 90 = 60 N forward, and the kayak speeds up. 4. 60 ÷ 0.000 001 = 60 000 000 Pa. The tiny point concentrates the force into a huge pressure that pushes the cork apart. 5. A snowboard and two skis both spread the weight over a large area, giving a low pressure the snow can hold up. Boots put the same weight on a small area, so the pressure is high and they sink.
Recap
- A bigger net force on the same object gives a bigger change in speed in the same time: F = m × a.
- Position-time graphs: flat means stopped, straight means steady speed, steeper means faster, curved means changing speed.
- Speed is the slope: change in position ÷ change in time.
- Free-body diagrams show every force on one object; combine up-down and left-right separately to get the net force.
- Pressure is the perpendicular force ÷ area, in pascals.
- Small area means high pressure (axe, pin, knife); large area means low pressure (skis, tractor tyres).
How is Year 9 maths going?
See the Year 9 maths guide