Scatter plots: describing a relationship between two variables

What this lesson covers
- A scatter plot shows whether two numerical variables change together, and how closely.
- An association between two variables does not show that one causes the other.
Do two variables change together?
- Two numerical variables, measured on the same people.
- Screen time and sleep, for 30 Year 11 students.
- Each student gives one pair of values.
Which variable goes where
- The variable that might explain goes across.
- The response goes up the side.
- One dot per student.
| Variable | Role | |
|---|---|---|
| Across (x) | screen time, hours a day | explanatory |
| Up (y) | sleep, hours a night | response |
| Each dot | one student, both values | 30 dots |
The scatter plot
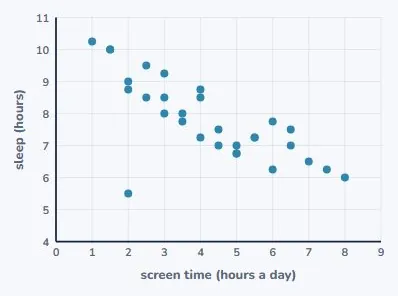
- Thirty dots, one for each student.
- Read the whole cloud, not single dots.
- It runs from top left to bottom right.
Direction
- Positive: both tend to rise together.
- Negative: as one rises, the other tends to fall.
- This one is negative.
| Direction | Example | Looks like |
|---|---|---|
| Positive | arm span and height | both rise together |
| Negative | screen time and sleep | one rises, one falls |
| None | shoe size and test score | no pattern |
Strength and form
- Strong: the dots sit close to a line.
- Weak: a loose cloud with a slight tilt.
- Here: fairly strong, and linear.
An unusual point
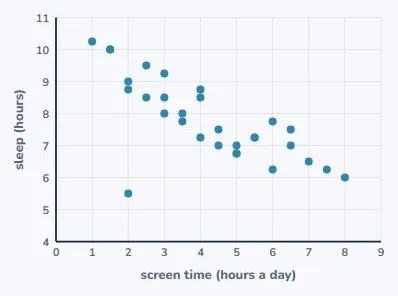
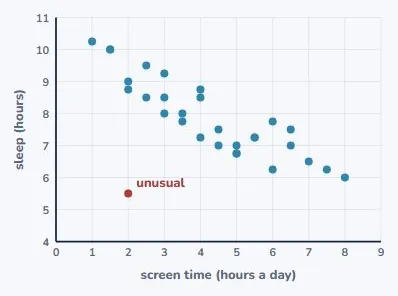
- Two hours of screen time, only 5.5 hours of sleep.
- Far below the students around it.
- Keep it, and suggest a reason.
Try it: add an unusual point
Describing it in context
- Every feature, in the words of the context.
- "More screen time, less sleep" beats "negative".
- Give values from the graph.
| Feature | Here | In context |
|---|---|---|
| Direction | negative | more screen, less sleep |
| Strength | fairly strong | dots close to a line |
| Form | linear | no curve |
| Unusual | (2, 5.5) | far below the rest |
Try it: read the scatter plot
A trend line
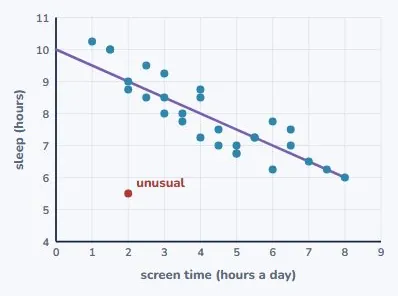
- Drawn through the middle of the cloud, by eye.
- It passes through (0, 10) and (8, 6).
- Its equation: y = 10 − 0.5x.
Making a prediction
- Substitute 4 hours of screen time.
- y = 10 − 2 = 8 hours of sleep.
- Inside the data, so it is fairly reliable.
| Step | Working |
|---|---|
| Trend line | y = 10 − 0.5x |
| Screen time 4 h | y = 10 − 0.5 × 4 |
| Predicted sleep | 8 hours |
| Reliable? | inside the data, strong: fairly |
Stay inside the data
- The data runs from 1 to 8 hours of screen time.
- Outside that range, the pattern may not hold.
- Predicting there is extrapolation.
Statistics explorer
A relationship is not a cause
- The data shows the two go together.
- It cannot show that screens cause less sleep.
- Say "is associated with".
| What the data shows | the two go together |
| What it cannot show | that screens cause less sleep |
| Other explanations | stress, homework, late shifts |
| Wording | "is associated with", not "causes" |
Where the marks are
- Achieved: describe features with the graph.
- Merit: justify them with values and the line.
- Excellence: bring in context and limitations.
What to take away
- Direction, strength, unusual points, then a careful claim.
| Scatter plot | explanatory across, response up |
| Direction | positive, negative or none |
| Strength | how close the dots are to a line |
| Unusual points | name them, suggest a reason |
| Trend line | predict inside the data only |
| Causation | a relationship is not proof |
| Enough data | at least 30 pairs |
Common mistakes
- Screen time causes less sleep.A scatter plot shows association, not cause: write more screen time is associated with less sleep, since stress or homework could explain both.
- Using y = 10 − 0.5x, 15 hours of screen time predicts 2.5 hours of sleep.The data only runs from 1 to 8 hours, so 15 hours is extrapolation and the prediction is unreliable.
- The relationship is negative.Describe it in context with values: more screen time, less sleep; fairly strong and linear, with (2, 5.5) unusual.
- Sleep goes across the bottom and screen time up the side.The explanatory variable, screen time, goes on the x-axis; the response, sleep, goes up the side.
Your turn: four questions
- Question 2 uses the trend line from this lesson.
- Question 4 wants careful wording.
As weekly hours of paid work rise, homework hours fall. Direction?
Use y = 10 − 0.5x to predict sleep for 3 hours of screen time.
Why is a prediction for 15 hours of screen time unreliable?
"Screen time causes less sleep." What can you claim instead?
Show answer
1. Negative: as one variable increases, the other tends to decrease. 2. y = 10 − 0.5 × 3 = 8.5 hours. 3. The data only runs from 1 to 8 hours of screen time, so 15 hours is extrapolation; the line gives 2.5 hours, which the data cannot support. 4. That more screen time is associated with less sleep in the sample. The data cannot show cause, because other factors such as homework or stress could explain both.
The answers
- Negative.
- 10 − 0.5 × 3 = 8.5 hours.
- 15 hours is far outside the data: extrapolation.
- More screen time is associated with less sleep.
Sample question: Achieved
For 32 Year 11 students, arm span (x, cm) is plotted across and height (y, cm) up. The arm spans run from 150 to 190 cm, and the dots rise from bottom left to top right, close to the trend line y = 0.9x + 18. Describe the direction of the relationship, then use the line to predict the height of a student with an arm span of 170 cm and say whether the prediction is reasonable.
Hint
Substitute 170 for x in the trend line, then check that 170 is inside the range of the data.
Answer
Positive: students with longer arm spans tend to be taller. Predicted height = 0.9 × 170 + 18 = 171 cm. This is reasonable, because 170 cm is inside the data (150 to 190 cm) and the dots sit close to the line.
Step by step
- Direction first. The dots rise from bottom left to top right, so as arm span goes up, height tends to go up. That is a positive relationship.
- To predict, use the trend line y = 0.9x + 18, where x is arm span and y is height.
- Substitute x = 170: y = 0.9 × 170 + 18.
- 0.9 × 170 = 153, and 153 + 18 = 171. So the predicted height is 171 cm.
- Is it reasonable? The data runs from 150 to 190 cm of arm span, and 170 is inside that, so this is not extrapolation.
- The dots are close to the line, so most students with that arm span will be near 171 cm, give or take a few centimetres.
- Check: arm span and height are usually similar for a person, and 171 is close to 170. That makes sense.
Full working
- dots rise left to rightpositive
- y = 0.9 × 170 + 18substitute x = 170
- y = 153 + 18 = 171
- 170 is inside 150 to 190not extrapolation
- Positive; predicted height 171 cm, reasonable
Sample questions: Merit
For 30 Year 11 students, hours of part-time work each week (x, from 0 to 15) are plotted across and hours of homework each week (y) up. The trend line drawn by eye passes through (0, 9) and (12, 3). Find the equation of the trend line, explain what its gradient means in context, and predict the homework for a student who works 8 hours a week.
Hint
The gradient is the change in y divided by the change in x between the two points, and the line crosses the y-axis at (0, 9).
Answer
y = 9 − 0.5x. Each extra hour of part-time work is associated with about half an hour less homework a week. For 8 hours of work: y = 9 − 0.5 × 8 = 5 hours of homework.
Step by step
- A straight line is y = mx + c, where m is the gradient and c is where the line crosses the y-axis.
- The line passes through (0, 9), so when x = 0, y = 9. That gives c = 9.
- Gradient = change in y ÷ change in x. From (0, 9) to (12, 3): y changes by 3 − 9 = −6 and x changes by 12 − 0 = 12.
- So m = −6 ÷ 12 = −0.5. The line is y = 9 − 0.5x.
- Gradient in context: for each extra hour of part-time work, the homework tends to be 0.5 hours lower. Say "tends to": this is a trend, not a rule for every student.
- The intercept 9 means a student who does no paid work does about 9 hours of homework a week, by this line.
- Predict for 8 hours: y = 9 − 0.5 × 8 = 9 − 4 = 5 hours of homework.
- 8 is inside the data, 0 to 15 hours, so the prediction is not extrapolation.
- Check: put x = 12 into the equation: 9 − 6 = 3. It matches the second point.
Full working
- c = 9line passes through (0, 9)
- m = (3 − 9) ÷ (12 − 0) = −0.5change in y ÷ change in x
- y = 9 − 0.5x
- gradient: 0.5 h less homework per extra hour of work
- y = 9 − 0.5 × 8 = 5
- y = 9 − 0.5x; about 5 hours of homework
A school canteen recorded the noon temperature (°C) and the number of ice blocks sold on 10 days: (14, 22), (16, 30), (17, 31), (19, 40), (20, 41), (21, 46), (23, 52), (24, 55), (25, 20), (26, 63). Describe the relationship (direction, strength, form), identify the unusual point and suggest a reason for it, and estimate how many more ice blocks tend to be sold for each extra degree.
Hint
Look at how sales change as temperature goes up, find the point that breaks the pattern, and use the lowest and highest points of the pattern for the rate.
Answer
Positive, strong and linear: on hotter days the canteen tends to sell more ice blocks. The day (25, 20) is unusual: on a hot day it sold far fewer than the pattern suggests (about 60). Perhaps the canteen ran out, was closed early, or many students were away on a trip. Rate: from (14, 22) to (26, 63) sales rise by 41 over 12 degrees, about 3.4 more ice blocks for each extra degree.
Step by step
- Read the pairs in order of temperature. Apart from one, the sales climb steadily: 22, 30, 31, 40, 41, 46, 52, 55, 63.
- Direction: as temperature goes up, sales tend to go up. That is positive.
- Form and strength: the rise is steady, with no curve, so the form is linear. The points stay close to a straight line, so it is strong.
- Now the odd one: at 25 °C only 20 were sold. Days at 24 °C and 26 °C sold 55 and 63, so the pattern says about 60.
- Suggest a reason from the context, and say "possibly": the canteen ran out of stock, closed early, or many students were out of school.
- Keep the point in the data, but leave it out when you work out the rate, so one strange day does not hide the pattern.
- Rate: from (14, 22) to (26, 63), sales rise 63 − 22 = 41 while temperature rises 26 − 14 = 12 degrees.
- 41 ÷ 12 ≈ 3.4. So each extra degree goes with about 3 or 4 more ice blocks sold.
- Classic mistake: saying "the relationship is weak" because of one unusual point. Describe the pattern, then the exception.
- Check the rate on a middle pair: from 19 °C to 23 °C is 4 degrees, and sales rise 52 − 40 = 12, about 3 per degree. Close to 3.4.
Full working
- sales rise as temperature risespositive, linear
- points close to a linestrong
- (25, 20): neighbours sell 55 and 63unusual
- 63 − 22 = 41 over 26 − 14 = 12 degrees
- 41 ÷ 12 ≈ 3.4
- Strong positive linear; (25, 20) unusual; about 3.4 more ice blocks per degree
Sample questions: Excellence
For 30 Year 11 runners, training hours per week (x, from 0 to 10) and time to run 3 km (y, minutes) give the trend line y = 21 − 0.4x. The relationship is moderately strong and negative. (a) Predict the 3 km time for 5 hours of training. (b) Find the training hours for which the line predicts a time of 0 minutes, and use this to explain why the line must not be used far outside the data. (c) A coach says: "The data proves that training more makes you faster." Evaluate this claim.
Hint
For (b), set y = 0 and solve. For (c), think about who chose to train more and what else could explain both variables.
Answer
(a) 21 − 0.4 × 5 = 19 minutes. (b) 0 = 21 − 0.4x gives x = 52.5 hours. A 0-minute run is impossible, so the straight-line pattern cannot keep going forever; outside 0 to 10 hours it is extrapolation, and real times level off. (c) Not proved. The data shows an association. Runners who are already fit may choose to train more, and age, coaching or other sports could affect both, so the data cannot show that the training itself causes faster times. Even so, a negative trend that is moderately strong is consistent with training helping.
Step by step
- (a) Substitute x = 5 into the line: y = 21 − 0.4 × 5 = 21 − 2 = 19 minutes. 5 hours is inside the data, so this is a fair prediction.
- (b) A time of 0 minutes means y = 0. Solve 0 = 21 − 0.4x.
- Add 0.4x to both sides: 0.4x = 21. Divide by 0.4: x = 52.5 hours a week.
- That is about 7.5 hours of training every day, and a time of 0 minutes is impossible. So the line cannot be right everywhere.
- The data only covers 0 to 10 hours. Beyond that, the pattern is unknown. In real life, times flatten out: nobody gets faster forever.
- So using the line outside 0 to 10 hours is extrapolation, and the 52.5 shows how silly it can get.
- (c) "Proves" and "makes" claim cause. A scatter plot from a survey can only show that two variables go together.
- Think about who trains more. Runners who are already fast may enjoy it and choose to train more. Then speed leads to training, not the other way round.
- Other things could affect both, such as age, a coach, or playing another sport. These are possible explanations, not facts.
- A fair conclusion: more training is associated with faster 3 km times in this sample. An experiment, where training is changed on purpose, would be needed to show cause.
- Check (b): 21 − 0.4 × 52.5 = 21 − 21 = 0. Correct.
Full working
- y = 21 − 0.4 × 5 = 19x = 5 is inside the data
- 0 = 21 − 0.4xset y = 0
- x = 21 ÷ 0.4 = 52.5
- 52.5 h ≫ 10 h, and a 0-minute run is impossibleextrapolation fails
- survey data shows associationfit runners may choose to train more
- 19 minutes; x = 52.5 h shows the line fails outside the data; association, not proof of cause
For 30 Year 11 students, hours of sleep the night before (x, from 5 to 10) and reaction time (y, ms) are plotted. The trend line is y = 400 − 20x. The relationship is negative but weak: at 7 hours of sleep, reaction times range from 230 to 330 ms. (a) Use the line to predict the reaction time for 7.5 hours of sleep. (b) Explain why one student who slept 7.5 hours could easily be 50 ms away from your prediction. (c) A headline says "Two more hours of sleep makes you 40 ms faster." Where does the 40 come from, and is the headline justified? (d) Suggest how to get stronger evidence.
Hint
For (c), find the change in y when x goes up by 2, then think about what a weak relationship and survey data can and cannot show.
Answer
(a) 400 − 20 × 7.5 = 250 ms. (b) The relationship is weak, so the dots are spread far from the line; at 7 hours alone the times cover 100 ms. (c) The gradient is −20 ms per hour, so 2 hours gives 2 × 20 = 40 ms. The headline is not justified: the line describes a weak trend in this sample, not what will happen to any one person, and survey data shows association, not cause (stress or illness could reduce sleep and slow reactions). (d) For example, a larger random sample with sleep measured by a tracker, or an experiment where the same students are tested after short and long sleep.
Step by step
- (a) Substitute x = 7.5: y = 400 − 20 × 7.5 = 400 − 150 = 250 ms.
- (b) A trend line gives a typical value, not an exact one. How close the dots are to the line decides how far off a single student could be.
- Here the relationship is weak. At 7 hours, times run from 230 to 330 ms, a spread of 100 ms. So a student 50 ms from the line is quite normal.
- (c) The gradient of the line is −20: each extra hour of sleep goes with 20 ms less reaction time on the line.
- Two more hours: 2 × 20 = 40 ms. That is where the 40 comes from.
- Problem 1: "makes you" claims cause. The data comes from a survey. Students who sleep less may be stressed, ill or up late gaming, and those things could also slow reactions.
- Problem 2: the line describes the group, not one person. With a weak relationship, sleeping 2 more hours tells you little about your own reaction time.
- Problem 3: the line comes from only 30 students. Another sample could give a different gradient.
- (d) Stronger evidence: a bigger random sample, sleep measured with a tracker instead of guessed, or an experiment where the same students are tested after a short and a long night.
- Check (a): 250 ms sits inside the range of times seen near 7 hours, 230 to 330 ms, so the prediction is sensible.
Full working
- y = 400 − 20 × 7.5 = 250substitute x = 7.5
- weak: at x = 7, y from 230 to 330100 ms spread
- gradient −20 ms per hour; 2 × 20 = 40
- survey data: association only; weak, so not for one person
- better: larger random sample, tracker, or an experiment
- 250 ms; the 40 ms is the gradient times 2; the headline is not justified
Least-Squares Regression
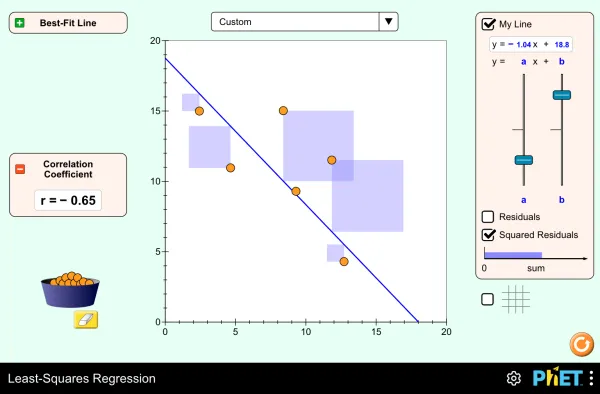
Full screen · PhET Interactive Simulations, University of Colorado Boulder, CC BY 4.0
Where science uses this
Practise this
Report a mistake
More in AS 91944
 Statistical enquiry: PPDAC and investigative questions6 min
 Planning data collection and sources of variation6 min
 Comparing groups: box plots, shift and overlap6 minScatter plots: describing a relationship between two variables6 min
 Writing a statistics conclusion: Achieved to Excellence6 min
 Statistical enquiry: 7 questions solved step by step10 min
 Comparing groups: 6 questions solved step by step11 min
 Scatter plots: 7 questions solved step by step10 min
Is your child on track?
Take the free placement test