Writing a statistics conclusion: Achieved to Excellence
What this lesson covers
- A conclusion answers the investigative question with evidence and says who it applies to.
- Reflecting on the whole enquiry means naming what limits the conclusion and what would improve it.
Where the investigation has got to
- The question, the data and the analysis are done.
- A call has been made from the box plots.
- Now it has to be answered in words.
| Sport and sleep | |
|---|---|
| Question | do sporty Year 11s tend to sleep longer? |
| Sport | median 8.75 h, box 8 to 9.25 |
| No sport | median 7.75 h, box 7.25 to 8.5 |
| Call | yes: 8.75 is above the no-sport box |
Answer the question you asked
- Use the question's own words.
- Back it with statistics and units.
- Say who it is about.
| Part | Sentence |
|---|---|
| Answer | sporty Year 11s here tend to sleep longer |
| Evidence | medians 8.75 h and 7.75 h, 1 h apart |
| Who | Year 11 students at our school |
Try it: answer the question
Who the conclusion covers
- The sample came from one school.
- So the claim is about that school's Year 11s.
- Not all teenagers, anywhere.
| Sample | 60 Year 11s at one school |
| Can claim | Year 11s at this school |
| Cannot claim | all New Zealand teenagers |
Try it: who the sample stands for
Link to what you expected
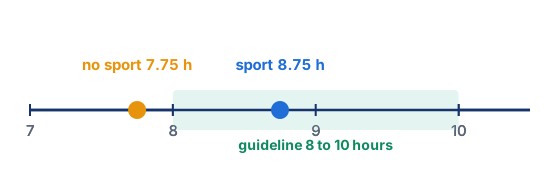
- The Ministry of Health guideline: 8 to 10 hours.
- The sport median sits inside it.
- The no-sport median sits just below.
| Guideline | 8 to 10 hours for ages 14 to 17 |
| Sport median | 8.75 h, inside the guideline |
| No-sport median | 7.75 h, just below it |
What limits the conclusion
- Name each source of variation in your data.
- Say how it could have affected the result.
- Be specific to this investigation.
| Issue | Variation | Effect |
|---|---|---|
| Self-reported | measurement | students may guess |
| One school night | induced | a match night differs |
| 30 per group | sampling | another 60 would differ |
How it could be improved
- Each limit gets a matching fix.
- A fix you could actually carry out.
- Not just "get more data".
| Limit | Improvement |
|---|---|
| Guessing | sleep tracker or diary for a week |
| One night | mean of five school nights |
| One school | sample several schools |
The question it raises
- Good enquiries end with a new question.
- Is there a relationship between training hours and sleep?
- That is a relationship question: a new cycle.
Reflecting on the whole process
- Was the question clear enough?
- Did the plan measure what it meant to?
- Would you trust the answer? Why?
Achieved, Merit, Excellence
- Each grade includes the one below.
- Merit adds statistics and links between stages.
- Excellence adds context and reflection.
| Grade | The conclusion |
|---|---|
| Achieved | describe features using the graph |
| Merit | justify with statistics, link each stage |
| Excellence | context, variation, reflect on it all |
Common mistakes
- All New Zealand teenagers who play sport tend to sleep longer.The sample came from one school, so the claim covers Year 11 students at this school and no wider.
- Walkers tend to have lower resting pulses than driven students.Back it with statistics and units: median 68 compared with 76 beats per minute, and the driven median is outside the walking box.
- To improve it, we should get more data.Match each limit to a fix you could carry out, e.g. sleep was self-reported, so use a sleep diary for a week.
- Pulses taken in period 1 is a limitation.Say what it did: walkers may have just arrived, raising their pulse (induced variation), so the true difference could be larger.
Sample question: Achieved
Investigative question: "Do Year 11 students at our school who live in town tend to take less time to get to school than those who live rurally?" 30 randomly chosen students in each group. Town: median 12 minutes, box 8 to 18 minutes. Rural: median 25 minutes, box 19 to 34 minutes. Make a call and write a conclusion that answers the question.
Hint
Check whether a median sits outside the other group's box, then answer the question in its own words with both medians.
Answer
A call can be made: the rural median, 25 minutes, is above the town box, which ends at 18. Conclusion: Year 11 students at our school who live in town tend to take less time to get to school than those who live rurally, with a median of 12 minutes compared with 25 minutes.
Step by step
- Before writing, decide whether the data lets you make a call.
- The town box runs from 8 to 18 minutes. The rural median, 25, is above 18, so it is outside the town box. A call can be made.
- Now answer the question you asked, using its own words: town students tend to take less time.
- Add the evidence: the two medians with units, 12 minutes and 25 minutes.
- Say who it is about: Year 11 students at our school, because that is where the sample came from.
- Classic mistake: writing "all town students are faster". The word "tend to" matters, because not every town student is.
- Check: the sentence has the question's words, two statistics with units, and the population.
Full working
- rural median 25 > 18, the top of the town boxcall can be made
- town median 12 min, rural median 25 min
- population: Year 11s at our school
- Town Year 11s at our school tend to take less time: median 12 min against 25 min
Sample questions: Merit
An investigation compared reaction times of Year 11 students at one school who learn a musical instrument with those who do not (30 in each group). Each student did one online reaction test on their own phone, at home, whenever they liked. The instrument group tended to be faster. Name two sources of variation in how the data was collected, explain how each could have affected the result, and suggest a specific improvement for each.
Hint
Look at the phones, the place and the time: what was different for different students?
Answer
Measurement variation: different phones have different screen and touch delays, so the times are not measured the same way; a faster phone could make a student look faster. Use the same device for everyone. Induced variation: students tested at different times and places, some tired late at night, some with distractions, and only one try each. Test everyone in class at the same time of day, with the mean of three tries.
Step by step
- Go through the plan and ask: what was not the same for every student?
- First: each student used their own phone. Phones differ in how quickly the screen shows a change and how quickly a tap is recorded.
- That is measurement variation: the same reaction could be recorded as different times on different phones.
- Effect: if the instrument players happened to have newer, faster phones, the instrument group would look faster than it really is.
- Improvement: test everyone on the same device, such as one school laptop.
- Second: students tested at home, whenever they liked. Some may have been tired late at night or had the TV on. And each had only one try.
- That is induced variation: the conditions, not the person, changed the reaction time.
- Effect: it adds extra scatter to both groups and could favour whichever group tested at better times.
- Improvement: test everyone in class, at the same time of day, and use the mean of three tries.
- Classic mistake: just saying "get more data". A bigger sample does not fix a bad measuring method.
Full working
- own phonesmeasurement variation
- effect: faster phones make some students look faster
- fix: same device for everyone
- home, any time, one tryinduced variation
- fix: in class, same time of day, mean of three tries
- Measurement variation (same device) and induced variation (same conditions, three tries)
The Ministry of Health guideline is at least 60 minutes of physical activity a day for young people. A survey of 30 randomly chosen Year 11 students in each group at one school recorded daily minutes of activity. Team sport: min 20, Q1 55, median 75, Q3 95, max 150. No team sport: min 0, Q1 25, median 40, Q3 60, max 110. Use the quartiles to estimate what fraction of each group meets the guideline, and link the result to what you would expect.
Hint
Each quartile marks a quarter of the group, so see where 60 falls among Q1, the median and Q3.
Answer
Team sport: 60 is between Q1 (55) and the median (75), so between half and three quarters meet the guideline. No team sport: 60 is the upper quartile, so only about a quarter meet it. This fits what you would expect, because team sport adds training and games to each week, but even in the sport group a noticeable part, at least a quarter, falls short.
Step by step
- Recall what quartiles mean: about a quarter of the values lie below Q1, half below the median, and three quarters below Q3.
- Team sport group: 60 lies between Q1 = 55 and the median = 75.
- So more than a quarter but fewer than half are below 60. That means between half and three quarters are at 60 or above.
- No team sport group: 60 is exactly the upper quartile.
- So about three quarters are below or at 60, and about a quarter are at 60 or above.
- Link to what you expected: team sport means training and games, so you would expect more activity, and the sport group is clearly better.
- But the guideline is not met by everyone even in the sport group: at least a quarter fall short, since Q1 = 55 is below 60.
- Classic mistake: saying "the sport median is 75, so everyone in the sport group meets the guideline". The median is the middle student, not everyone.
- Check: the medians 75 and 40 sit on either side of 60, which matches one group mostly meeting it and the other mostly not.
Full working
- sport: Q1 55 < 60 < median 75between a quarter and a half below 60
- sport: between 12 and 34 meet it
- no sport: Q3 = 60about 34 at or below 60
- no sport: about 14 meet it
- expected: team sport adds activity
- Sport: between half and three quarters meet it; no sport: about a quarter
Sample questions: Excellence
Investigative question: "Do Year 11 students at Kauri College who take the bus to school tend to get less sleep on a school night than those who walk?" 30 randomly chosen students in each group reported their sleep for one Wednesday night. Bus: median 7.5 h, box 6.75 to 8.25 h. Walk: median 8.5 h, box 7.75 to 9 h. The Ministry of Health recommends 8 to 10 hours for 14 to 17 year olds. Write an Excellence conclusion: answer with evidence, link to the guideline and a possible reason, explain one limitation and which way it could push the result, give a matching improvement, and pose a new question.
Hint
Work through answer, evidence, who, context, limitation with its effect, improvement and a new question, one sentence each.
Answer
Model answer: Year 11 students at Kauri College who take the bus tend to sleep less on a school night than those who walk. The walk median, 8.5 h, is above the bus box (6.75 to 8.25 h), and the bus median, 7.5 h, is below the walk box (7.75 to 9 h); the medians are 1 hour apart. The walk median sits inside the 8 to 10 hour guideline but the bus median is half an hour below it, possibly because bus students live further away and must get up earlier. Sleep was self-reported for one Wednesday; students may round to the nearest hour or remember a bad night, and if one group had a late event that night the gap could be bigger or smaller than usual. Recording sleep in a diary for five school nights and using each student's mean would reduce this. This applies to Kauri College's Year 11s, not all teenagers. A new question: is there a relationship between distance from school and hours of sleep for Year 11s at Kauri College?
Step by step
- Start by checking the call. Walk median 8.5 is above the bus box, which ends at 8.25. Bus median 7.5 is below the walk box, which starts at 7.75. A call can be made.
- Answer the question in its own words, with "tend to": bus students tend to sleep less.
- Evidence: both medians with units, and the 1-hour difference. Mention that each median is outside the other box.
- Who: Year 11 students at Kauri College only, because that is where the random sample came from.
- Context: compare with the guideline of 8 to 10 hours. 8.5 is inside it, 7.5 is half an hour below it.
- Possible reason, worded as a suggestion: bus students may live further away and have to get up earlier.
- Limitation: self-reported sleep for one night. Students may guess, and one night may not be typical, such as a match the night before.
- Say which way it could push the result. If one group happened to have a late event that night, the gap could be larger or smaller than usual, so the 1 hour is uncertain.
- Matching improvement: a sleep diary or tracker for five school nights, using each student's mean.
- New question: the possible reason points to distance. A relationship question about distance and sleep is the natural next cycle.
- Check: the answer has every part: answer, evidence, who, context, limitation with direction, fix and a new question.
Full working
- 8.5 > 8.25 and 7.5 < 7.75each median outside the other box: call
- medians 8.5 h and 7.5 h1 hour apart
- guideline 8 to 10 h: walk inside, bus 0.5 h below
- limitation: self-reported, one nightcould push the gap either way
- improvement: diary or tracker, mean of five nights
- new question: distance and sleep, a relationship
- Bus students at Kauri College tend to sleep less (7.5 h against 8.5 h), with context, limitation, fix and a new question
Rangi concluded: "Year 11 students at our school who walk to school tend to have lower resting pulse rates than those who are driven (median 68 against 76 beats per minute)." When reflecting, he finds two problems. Walkers were measured as soon as they arrived at school, while driven students were measured after 10 minutes sitting in class. Also, most of the walkers were volunteers from the athletics club. For each problem, name the source of variation or bias and explain which way it pushes the difference. Then decide what Rangi can honestly conclude, and design a better plan.
Hint
Ask, for each problem, whether it makes the walkers' pulses look higher or lower than they really are.
Answer
Problem 1 is induced variation: walkers had just exercised, which raises their pulse, so it makes the gap look smaller than it really is. Problem 2 is sampling bias: athletes tend to have low resting pulses, so it makes the walkers look lower and the gap look bigger. The two push in opposite directions, so he cannot tell whether the true gap is bigger or smaller than 8, or whether it is real at all. Honest conclusion: these data suggest walkers may have lower pulse rates, but the method does not allow a reliable call. Better plan: choose 30 walkers and 30 driven students at random from the roll, and measure everyone seated in class after 2 minutes of rest at the same time of day.
Step by step
- Take the problems one at a time and ask: does this make the walkers' pulse look higher or lower than it really is?
- Problem 1: walkers were measured straight after walking. Exercise raises the pulse. That is induced variation: the conditions changed the values.
- Effect: the walkers' recorded pulses are too high. Their true resting median is probably below 68, so the true gap is probably bigger than 8.
- Problem 2: most walkers were athletics volunteers. Athletes tend to have low resting pulses. The sample was not random, so it is biased.
- Effect: the walker group looks fitter than walkers in general. This makes the gap look bigger than it really is.
- Now combine them. One problem shrinks the gap and the other stretches it. We do not know which is larger.
- So the 8 beats per minute could be too big or too small, and with this method we cannot even be sure the difference is real.
- Honest conclusion: the data suggests walkers may tend to have lower resting pulses, but the way the data was collected means a reliable call cannot be made.
- Better plan: list walkers and driven students from the Year 11 roll and pick 30 of each at random. This removes the volunteer bias.
- Measure everyone in the same conditions: seated in class, after 2 minutes of rest, at the same time of day. This removes the induced variation.
- Classic mistake: saying "the results are biased" without saying which way. At Excellence, the direction is the point.
Full working
- measured on arrivalinduced variation: walkers' pulse too high
- effect 1: true gap bigger than 76 − 68 = 8
- athletics volunteerssampling bias: walkers look fitter
- effect 2: true gap smaller than 8
- opposite directionsno reliable call
- better: 30 random per group from the roll, all measured seated after 2 minutes' rest
- No reliable call; redo with random samples and the same conditions
Before you hand it in
- Five checks.
- Every one is a place marks are lost.
- Tick them off.
| Check | Means |
|---|---|
| Answered the question? | in its own words |
| Statistics with units? | medians, IQRs, values |
| Population named? | and no wider |
| Variation named? | with what it did |
| Improvement given? | and a new question |
What to take away
- Answer, evidence, who, context, limits, improvements.
| Answer | the question, in its own words |
| Evidence | statistics, with units |
| Who | the population sampled, no wider |
| Expected? | link to context and what you knew |
| Limits | name the sources of variation |
| Improve | a fix for each limit |
| Next | a new question it raises |
Your turn: four questions
- Walking versus being driven to school.
- Question 2 wants a full sentence.
| Resting pulse, 30 in each group | |
|---|---|
| Data | Walk: median 68, box 62 to 74. Driven: median 76, box 70 to 82. |
| 1 | Can you make a call about resting pulse? Explain. |
| 2 | Write the conclusion sentence, with evidence. |
| 3 | Pulses were taken in period 1. Which variation could that cause? |
| 4 | Suggest one improvement to the investigation. |
Show answer
1. Yes. The driven median, 76, is outside the walking box, which ends at 74. 2. Year 11 students at this school who walk to school tend to have lower resting pulse rates than those who are driven: median 68 compared with 76 beats per minute, 8 apart. 3. Induced variation: walkers may have just arrived after walking, raising their pulse, so the true difference could be even larger. 4. For example: rest for five minutes before measuring, or use a larger sample from several schools.
The answers
- Yes: 76 is above the walking box, which ends at 74.
- Walkers tend to have lower pulses: 68 vs 76.
- Induced: walkers may have just arrived.
- Rest before measuring, or sample more schools.
Report a mistake
More in AS 91944
 Statistical enquiry: PPDAC and investigative questions6 min
 Planning data collection and sources of variation6 min
 Comparing groups: box plots, shift and overlap6 min
 Scatter plots: describing a relationship between two variables6 minWriting a statistics conclusion: Achieved to Excellence6 min
 Statistical enquiry: 7 questions solved step by step10 min
 Comparing groups: 6 questions solved step by step11 min
 Scatter plots: 7 questions solved step by step10 min
Is your child on track?
Take the free placement test