A science idea in Aotearoa: carbon dioxide and a more acidic ocean
What this lesson covers
- The science idea: carbon dioxide from human activity is rising in the air, and the ocean around New Zealand is absorbing it and becoming more acidic.
- Baring Head (from 1972) and the Munida Transect off Otago (from 1998) are the two long New Zealand records behind the idea.
- Repeatable data, patterns, technology and links to known chemistry each played a part at a different stage.
- Collaboration, shared units and methods, and tentativeness shape where the idea stands today.
- The features interact: a need drove new tools, the tools gave data, and the data showed patterns that raised new questions.
The idea and its story
- The science idea: people are adding carbon dioxide (CO₂) to the air, much of it dissolves in the sea, and the sea around Aotearoa is slowly becoming more acidic.
- It was built in stages over more than fifty years, from a single measuring station to a national network.
- This is the kind of story the exam gives you in a resource booklet. In 2024 one of the two ideas was Dr Kim Currie's ocean measurements off Otago, so this lesson also shows how to use a resource like that.
- At each stage, ask: what feature of science moved the idea forward, and why did it matter?
1972: a southern station at Baring Head
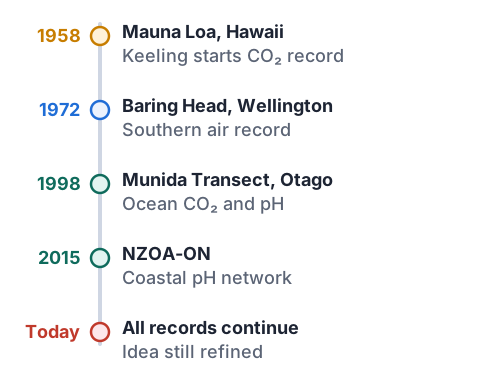
- In 1958 the American scientist Charles Keeling began measuring CO₂ in clean air at Mauna Loa in Hawaii. He wanted a matching record from the Southern Hemisphere to see whether the whole planet was changing.
- New Zealand scientists at the DSIR took up that opportunity, and Dave Lowe was given the job of starting the measurements. The record at Baring Head, a bare headland at the entrance to Wellington Harbour, began in 1972.
- Baring Head was chosen by critical thinking about the data: in a southerly, the air arriving there has blown across the Southern Ocean and not over land, cities or forests, so it shows the background air of the region.
- Today it is the longest continuous CO₂ record in the Southern Hemisphere, second in the world only to Mauna Loa.
Making the data repeatable and checkable
- The analyser runs continuously, and only readings taken in steady southerly winds are kept for the background record, so a passing car or a local fire cannot spoil it.
- The instruments are checked against reference gases of known CO₂ content, so a reading in 1980 can be compared fairly with one today, even though the equipment has been replaced many times.
- Results are given in parts per million (ppm), the same unit used at Mauna Loa and every other station, so records from different countries can be laid side by side.
- This matters because a rise of 1 or 2 ppm a year is tiny; without careful, identical methods, a real trend could not be separated from errors.
Example: reading the Baring Head record
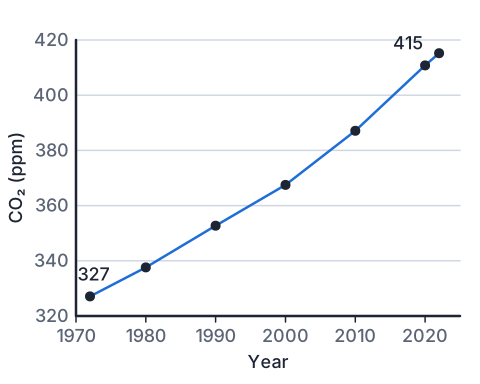
- The table gives the trend value of CO₂ at Baring Head each December, with the seasonal ups and downs removed.
- Describe the pattern, and work out how fast CO₂ rose in the 1970s compared with the 2010s.
| Year (December) | CO₂ at Baring Head (ppm) |
|---|---|
| 1972 | 327.1 |
| 1980 | 337.6 |
| 1990 | 352.7 |
| 2000 | 367.5 |
| 2010 | 387.1 |
| 2020 | 410.8 |
| 2022 | 415.2 |
- 1972 to 1980: (337.6 − 327.1) ÷ 8 ≈ 1.3 ppm per yearrise ÷ years
- 2010 to 2020: (410.8 − 387.1) ÷ 10 ≈ 2.4 ppm per yearrise ÷ years
- 1972 to 2022: 415.2 − 327.1 = 88.1 ppm, a rise of about 27%88.1 ÷ 327.1
- CO₂ rises every decade, and the rise is speeding up
Two patterns in the record
- The long-term pattern is a steady, speeding-up rise, which matches the growing amount of fossil fuel burned around the world.
- There is also a small yearly wobble: CO₂ dips when plants are growing fast and rises when they are not. At Baring Head the wobble is the opposite way round to Mauna Loa, because the seasons are reversed in the south.
- Spotting that opposite wobble showed that the record was measuring real, planet-wide processes, not local noise, which made scientists trust the long-term rise.
- Year-to-year changes in the rate of rise also line up with El Niño and La Niña, an interaction between ocean, weather and the carbon cycle that the long record made visible.
Linking to what chemists already knew
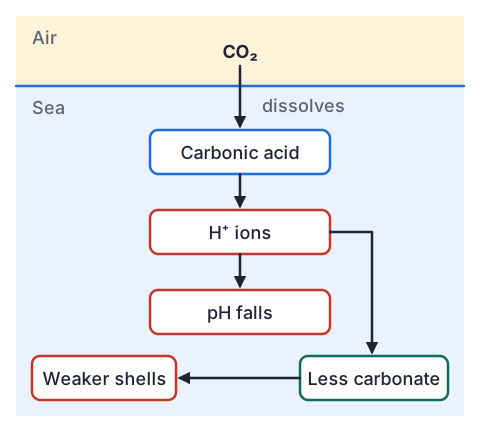
- Chemists already knew that CO₂ dissolves in water and forms a weak acid, carbonic acid, which releases hydrogen ions (H⁺). More H⁺ means a lower pH.
- Linking the rising-CO₂ evidence to this model made a prediction: if the air holds more CO₂, the sea should take up more and its pH should fall.
- The same H⁺ ions also react with carbonate ions in seawater, leaving less carbonate for shellfish, corals and plankton to build their shells.
- A prediction from a model is not yet evidence. Someone had to go out and measure the sea for many years to test it.
1998: the Munida Transect off Otago
- In 1998 Kim Currie, Keith Hunter and Malcolm Reid, working for NIWA and the University of Otago, started sampling a 65 km line from Otago Harbour out into sub-Antarctic water, every two months.
- Few people had measured seawater CO₂ this precisely before, so Dr Currie had to design and build equipment, and improve it over the years. Research vessels carried the samples back to the lab.
- To understand the CO₂ she also had to measure temperature, salinity, pH and alkalinity on every voyage, because all of them affect how much CO₂ the water holds.
- The result is the longest record of ocean pH in the Southern Hemisphere, now coordinated by Sebastiaan van de Velde at Earth Sciences New Zealand.
Example: what the Munida data shows
- Stats NZ fitted a straight-line trend to the Munida data from 1998 to 2020. Use the table to describe the pattern and link it to Baring Head, where CO₂ rose from 364.6 ppm to 410.8 ppm over the same years (December trend values, from the same Stats NZ greenhouse gas indicator as the table above).
| Measure (surface water off Otago) | 1998 | 2020 |
|---|---|---|
| pH (trend) | 8.092 | 8.057 |
| Dissolved CO₂, pCO₂ (µatm) | 349.9 | 384.9 |
| Acidity (hydrogen ions) | Starting value | 8.6% higher |
- pH change: 8.057 − 8.092 = −0.035 over 23 yearssmall, but pH is a log scale
- −0.035 ÷ 23 ≈ −0.0015 pH units per yearStats NZ's fitted trend gives −0.0016
- pCO₂ up 35 µatm; air CO₂ up 46.2 ppm (364.6 to 410.8)both rise together
- as CO₂ in the air rises, more dissolves and the sea's pH falls, as the model predicted
Checking with the rest of the world
- One record from one place could be a local quirk. Dr Currie met scientists running ocean time series in other countries and compared how each team measured, so that their numbers meant the same thing.
- Once methods and units (ppm, µatm, pH) were agreed, the records could be compared, and they showed the same falling pH around the world.
- The findings were published in peer-reviewed journals, where other experts checked the methods before the results were accepted.
- In 2015 New Zealand set up a coastal network, NZOA-ON, managed by Dr Currie, to measure pH at sites close to shore with sampling partners around the country.
Where the idea stands today
- The idea is strongly supported offshore, but it is still tentative in the details. Coastal pH swings so much with rivers, tides and seasons that Stats NZ says a much longer record is needed before trends can be confirmed at those sites.
- New evidence keeps refining it: a recent Munida study found that calcium carbonate in shallow shelf waters can buffer the change, which may slow acidification there.
- Social and cultural factors shape the questions. Kaimoana such as pāua, pipi and tuangi are taonga to iwi and hapū, and mussels and oysters matter to the aquaculture industry, so people want to know which coasts and species are most at risk.
- That need, and the opportunity of a long baseline already in place, is why monitoring keeps expanding instead of stopping.
Which features mattered, and when
- Most stages show more than one feature. For the exam you need the feature, a specific example, and why it was significant.
| Stage | Feature | Why it was significant |
|---|---|---|
| Keeling wants a southern record | Needs and opportunities, collaboration | Without a southern station, nobody could show the rise was global |
| Choosing Baring Head, keeping southerly data | Critical thinking, repeatable data | Clean, consistent air lets a small yearly rise be seen above the noise |
| 50 years of ppm readings | Patterns and interactions | Showed a rise that is speeding up, and links to El Niño |
| CO₂ forms carbonic acid | Linking evidence to existing models | Predicted that the sea's pH should fall |
| Currie builds her own equipment | Technology, creativity | Made precise seawater CO₂ and pH readings possible |
| Comparing methods worldwide | Shared language and conventions, checking claims | Matched records showed the pattern was real everywhere |
| Coastal sites too variable | Tentativeness | The idea is still being tested and refined |
Example: technology and patterns at three grades
- Question: Using the Munida resource, discuss how the development and use of technology and interpreting patterns contributed to the science idea.
- Achieved: Dr Currie built new equipment to measure CO₂ in seawater accurately. Her time series showed a pattern: ocean pH off Otago is falling.both features named, each with a resource example
- Merit: The equipment was significant because no one had measured seawater CO₂ this precisely before; without it, a fall of under 0.002 pH units a year would be lost in measurement error. The pattern was significant because it showed the ocean was changing with the air, giving a reason to keep investigating.why each feature mattered
- Excellence: The new equipment made precise, repeated readings possible every two months for over twenty years, and only a record that precise and that long could reveal such a slow pattern. The pattern then raised new questions, such as what other variables control CO₂, which pushed her to add temperature, salinity and alkalinity, so each feature kept driving the other.how the two features interact
- Excellence links the features with because, which meant, and so
Common mistakes
- The pH only fell from 8.09 to 8.06, so the ocean has hardly changed.pH is a log scale, so that small drop is an 8.6% rise in hydrogen ions over 23 years, which is a real change for shell-building animals.
- The ocean is becoming acidic, so its pH is now below 7.Seawater is still basic, around pH 8.06; acidification means the pH is falling towards 7, not that it has passed it.
- Baring Head proves that the ocean is acidifying.Baring Head measures CO₂ in the air; the ocean evidence comes from sampling the sea, such as the Munida Transect, and evidence supports an idea rather than proving it.
- Existing models: Dr Currie used her earlier pH readings.An existing model is an accepted idea, here that dissolved CO₂ forms carbonic acid; earlier readings from the same study are part of the data, not a model.
Make water more acidic with your own breath
You need: 2 red cabbage leaves, hot tap water, a jug, 2 clear glasses, a pinch of baking soda, a drinking straw
- Tear the cabbage leaves into the jug, cover with hot tap water, leave for 10 minutes, then pour off the purple liquid. This is your pH indicator.
- Pour the same amount into two glasses and stir a tiny pinch of baking soda into each, so both turn blue-green, like slightly basic seawater.
- Keep one glass as your control. Blow gently through the straw into the other for two to three minutes.
- Compare the colours against a white sheet of paper every 30 seconds.
- Look for: the glass you blow into shifts back towards purple while the control stays blue-green. The CO₂ in your breath dissolves and makes carbonic acid, lowering the pH, just as CO₂ from the air does to the sea.
Safety: Only ever blow out through the straw, never suck in, so you do not swallow the cabbage water, and wipe up spills before they stain.
Your turn: an exam-style question
- Use this lesson as your resource. Focus on two features: responding to needs and opportunities, and repeatable, checkable data.
Give one example of a need or an opportunity that helped start the Baring Head record. (Achieved)
Give one way the Baring Head team made their data repeatable and checkable. (Achieved)
Why was repeatable, checkable data significant for this idea? (Merit)
How did needs and opportunities and repeatable data work together to develop the idea? (Excellence)
Show answer
1. Opportunity: Keeling wanted a Southern Hemisphere record to match Mauna Loa, and New Zealand scientists took up that chance (the need was to find out whether rising CO₂ was global). 2. They kept only readings from steady southerly winds, and checked the analyser against reference gases so readings from different years can be compared. 3. CO₂ rises by only about 1.3 to 2.4 ppm a year, so without identical, checked methods over fifty years the trend could not be told apart from measurement error, and other stations could not compare their numbers with it. 4. The need for a southern record gave the reason to build a station and keep it running; that commitment made it possible to collect consistent data for decades; the long, repeatable record then showed a speeding-up rise, which created a new need, to find out where the CO₂ goes, and so led to measuring the ocean at Munida. Each feature fed the other.
Recap
- Idea: rising CO₂ from human activity is making the sea around Aotearoa more acidic.
- Baring Head (from 1972) shows air CO₂ rising from 327 to 415 ppm, and the rise speeding up.
- Munida (from 1998) shows ocean pH falling from 8.092 to 8.057, as the carbonic acid model predicted.
- Key features: needs and opportunities, repeatable data, patterns, linking to models, technology, collaboration, shared conventions and tentativeness.
- For Excellence, show how one feature made the next one possible.
How is NCEA Level 1 maths going?
See the NCEA Level 1 maths guide