Variation in populations and gene tracking
What this lesson covers
- A population's gene pool and how to calculate an allele frequency.
- Four population sources of change: small population size, differing survival, migration and non-random mating.
- Reading a pedigree to work out genotypes, and which genotypes cannot be confirmed.
- Gene tracking methods: pedigrees, DNA markers and profiling, and whole-genome sequencing, as used for kākāpō.
- Why genetic relationships are identified: health decisions, breeding plans and conservation.
- Evaluating tracking findings: what is certain, what is only probable, and what they mean for the future.
Populations, gene pools and allele frequency
- A population is all the members of one species in an area that can interbreed.
- The gene pool is every allele of every gene in that population. Each individual holds two alleles of each gene, so a population of 100 has 200 alleles of any one gene.
- Allele frequency is the share of the gene pool that is one allele: the number of copies of that allele divided by the total number of alleles of that gene.
- A population changes genetically when its allele frequencies change from one generation to the next. Mutation, meiosis and fertilisation make variation in individuals; the four population sources below change how common each allele is.
- frequency of b = copies of b ÷ (2 × number of individuals)two alleles each
- each BB has 0 b, each Bb has 1 b, each bb has 2 bcount copies, not individuals
Example: a storm in a small population
- Suppose a population of 100 snails has 36 BB, 48 Bb and 16 bb. A storm kills snails at random, and the 10 survivors are 2 BB, 4 Bb and 4 bb.
- Find the frequency of allele b before and after. (In the figure each dot on the left stands for 10 alleles; on the right each dot is one allele.)
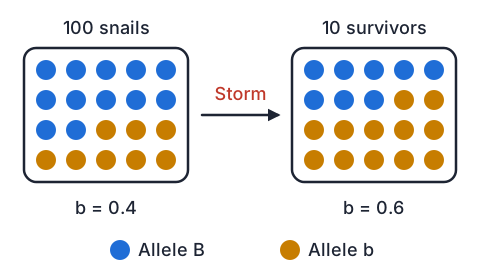
- before: b = 48 + 2 × 16 = 80 copies out of 200Bb has one b, bb has two
- before: b = 80 ÷ 200 = 0.4
- after: b = 4 + 2 × 4 = 12 copies out of 2010 snails, 20 alleles
- after: b = 12 ÷ 20 = 0.6
- B went from 0.6 to 0.4 by pure chancethe storm did not pick snails by genotype
Source 1: small population size
- In a small population, chance decides which individuals breed and which alleles end up in the next generation. Random change in allele frequency is called genetic drift.
- A bottleneck is a sudden crash in numbers, from a storm, disease or predators. The survivors carry only some of the alleles, so variation is lost, and a rare allele can vanish or become common.
- With few possible mates, relatives breed with each other more often. Inbreeding makes homozygous genotypes more likely, so harmful recessive alleles show up and fertility can drop.
- Kākāpō went through a severe bottleneck. Every kākāpō alive today descends from just 40 birds, and scientists think their low diversity and inbreeding help explain the birds' poor sperm quality and low hatching success.
| Kākāpō | Number |
|---|---|
| Before people arrived | Probably hundreds of thousands |
| Birds left in 1995 | 51: 50 from Rakiura (Stewart Island) and 1 male, Richard Henry, from the mainland |
| Birds that bred and are the ancestors of every kākāpō hatched since 1995 | 40: Richard Henry and 39 Rakiura birds |
| Genetic diversity lost since the 1800s | About 70 to 80% |
| Birds alive in 2021 | 201 |
Source 2: differing rates of survival
- Individuals with some phenotypes survive and breed better than others in their environment, so they pass on more of their alleles. This is natural selection.
- An albino animal in the wild is easier for predators to see and often has poor eyesight, so fewer survive to breed. The albinism allele becomes rarer, but it is not removed, because carriers look normal and survive just as well.
- Sometimes the heterozygote does best. Carriers of one sickle cell allele are protected against severe malaria, so where malaria is common the allele stays frequent even though two copies cause sickle cell disease.
- Survival depends on the environment, so if the environment changes, which alleles are favoured can change too. A population with more variation is more likely to have some individuals that cope.
Sources 3 and 4: migration and non-random mating
- Migration (gene flow) is individuals moving into or out of a population. Arrivals can bring alleles that were rare or missing, which increases variation; leavers take their alleles with them.
- Richard Henry was the only mainland kākāpō to breed, so his chicks carried alleles the Rakiura birds lacked. Kākāpō Recovery also moves birds between predator-free islands so separate groups do not drift apart.
- Non-random mating is when mates are not chosen by chance: animals pick mates with a certain trait, or relatives breed together. It changes which genotypes appear, often making homozygotes more common.
- Kākāpō Recovery manages mating on purpose, choosing pairs and using artificial insemination so that closely related birds are not paired and rare alleles are kept.
| Source | What happens | Usual effect on variation |
|---|---|---|
| Small population size | Chance changes allele frequencies; inbreeding | Decreases |
| Differing survival | Better-suited phenotypes leave more offspring | Favoured alleles rise, others fall |
| Migration | Individuals and their alleles move in or out | Usually increases (arrivals) |
| Non-random mating | Mates chosen by trait or relatedness | More homozygotes |
Example: tracking PKU through a family
- Phenylketonuria (PKU) is a recessive condition (allele p) in which the body cannot break down phenylalanine, an amino acid in food. New Zealand tests newborn babies for it with a heel-prick blood sample, because a special diet from birth prevents brain damage.
- In a pedigree, squares are males, circles are females, shaded means affected, and a horizontal line joins parents.
- Work out every genotype you can, and say which you cannot be sure of.
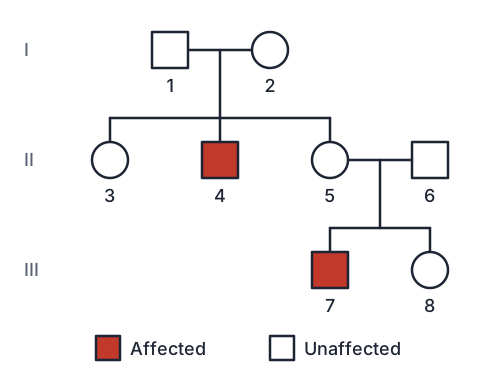
- 4 is affected, so 4 is pprecessive trait needs two p
- 1 and 2 are unaffected but each gave 4 a p, so 1 and 2 are both Pp
- 7 is affected (pp), so 5 and 6 each passed on a p; both are Pp
- 3 is unaffected with Pp × Pp parents: PP or Ppthe pedigree cannot tell which
- unaffected child of Pp × Pp: 1 PP : 2 Pp, so P(carrier) = ⅔the pp box is ruled out
- 8 is unaffected with Pp × Pp parents: PP or Pp, chance of carrier ⅔
- only a DNA test could confirm 3 and 8
Gene tracking methods
- Gene tracking finds out whether a gene, an allele, a genetic marker or a DNA sequence is present in an individual or a population, and follows it between relatives.
- A pedigree uses phenotypes over generations. It is cheap and needs no samples, but it can only give probabilities for unaffected individuals.
- DNA tests read the DNA itself. A marker is a short, variable stretch of DNA that is inherited along with an allele or that differs between individuals, like a barcode.
- Whole-genome sequencing reads all of an organism's DNA. Comparing the genomes of many individuals shows how closely related they are and which DNA differences go with which traits.
| Method | What it shows | Limit |
|---|---|---|
| Pedigree | How a trait is inherited; some genotypes | Unaffected carriers stay uncertain |
| Punnett square | Expected ratios and probabilities | A prediction, not an outcome |
| DNA profiling with markers | Who is related to whom; parentage | Shows relationship, not every allele |
| Testing for a known allele | Confirms carriers | Only finds alleles already known |
| Whole-genome sequencing | All DNA differences; relatedness; genes linked to traits | Costly; needs many samples to link genes to traits |
Example: sequencing every kākāpō
- Scientists working with Kākāpō Recovery and Ngāi Tahu sequenced the whole genome of nearly every kākāpō alive in early 2018. Ngāi Tahu holds the genome data as a taonga, so it is shared only by application.
- Combined with decades of records on each bird, the genomes were used to find which DNA differences go with differences in growth, disease, clutch size and egg fertility.
- What was the purpose, and how is the purpose met?
| Kākāpō genome study | Finding |
|---|---|
| Birds sequenced | 169, nearly every kākāpō alive in early 2018 |
| Records used | Phenotype data spanning five decades |
| Traits linked to DNA regions | Growth, disease susceptibility, clutch size, egg fertility |
| Diversity under management | Genome-wide diversity kept over the past 45 years |
| Uses | Choosing birds to move; watching birds at risk of poor growth or disease |
- purpose: know exactly how related every pair of birds isto avoid pairing relatives
- met by comparing genomes, which is more exact than the pedigreeDNA shows the shared alleles directly
- purpose: keep rare alleles, such as those from Richard Henry's lineprotect variation
- purpose: spot birds likely to grow poorly or get sick, and care for them earlyDNA linked to traits
- genome data guide mating and moves, keeping diversity and evolutionary potential
Evaluating findings: what Excellence looks like
- To evaluate, weigh what the tracking shows: what is certain, what is only a probability, what was assumed, and what it means for individuals and the population in the future.
- Certain versus probable: an affected individual's genotype is certain; an unaffected child of two carriers has only a ⅔ chance of being a carrier until a DNA test settles it.
- Assumptions: a bird brought from another island is often assumed not to carry an allele because none of its relatives showed it, but no record is not proof.
- Surprises: kākāpō genomes showed that the long-isolated Rakiura birds carry fewer harmful mutations than the mainland birds did, probably because inbreeding over thousands of years exposed and removed some of them. A small population is not always doomed.
- Limits in time: the 2018 study covers the birds alive then. The population has grown since, so every new chick needs sampling to keep the picture complete.
| Kākāpō today | DOC |
|---|---|
| Kākāpō alive | 325 |
| Conservation status | Threatened, Nationally Critical |
| Main threats | Predators, disease, low hatching success |
Exam-style question: albino chicks in a sanctuary
- Context: A predator-free island sanctuary breeds a rare flightless bird, all descended from a few founders. Albinism in this bird is caused by a recessive allele (a); the normal allele (A) is dominant. Male 5 was moved in from another island where no albino chick has ever been recorded.
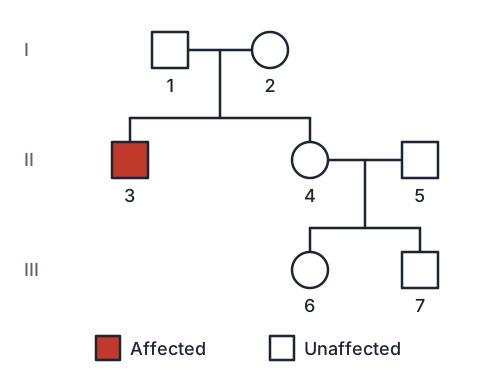
Give the genotypes of birds 1, 2 and 3, and the possible genotypes of bird 4.
Explain why the genotype of bird 4 cannot be confirmed from the pedigree, and calculate the chance that she is a carrier.
The rangers plan to pair female 6 with her uncle, bird 3. Discuss this plan. Include the chance that a chick from the pair is albino (assume bird 5 is AA), why this is non-random mating, and how a DNA test for the a allele would change the decision. Evaluate how reliable your answer is.
Show answer
1. (Achieved) 3 is albino, so aa. 1 and 2 are unaffected but each passed an a to bird 3, so both are Aa. Bird 4 is unaffected, so AA or Aa. 2. (Merit) Aa × Aa gives 1 AA : 2 Aa : 1 aa. Bird 4 is not aa, so she is one of the three other boxes, and 2 of those 3 are Aa: a ⅔ chance she is a carrier. Her chicks 6 and 7 do not help: with an AA mate every chick is unaffected whether she is AA or Aa, so the pedigree cannot separate the two. 3. (Excellence) Bird 6 is a carrier only if 4 is Aa (⅔) and passed on a (½): ⅔ × ½ = ⅓. Bird 3 is aa and always passes on a, so a chick is albino only if 6 is Aa and passes on a (½): ⅓ × ½ = ⅙, about 17%. Every chick from bird 3 also gets an a, so all the unaffected chicks are carriers, raising the frequency of a. Pairing relatives on purpose is non-random mating; in a small population it makes aa chicks, which are less likely to survive in the wild, more likely. A DNA test on bird 6 settles it: if she is AA, no chick will be albino (all will be Aa carriers); if she is Aa, each chick has a ½ chance. Pairing 6 with an unrelated AA male instead gives no albino chicks at all. The ⅙ depends on the assumption that bird 5 is AA; no recorded albino chicks on his island is not proof, and if 5 were Aa the risk would be higher. So the purpose of tracking, to keep the a allele from rising and avoid albino chicks, is best met by DNA testing 4, 5 and 6 before choosing pairs.
Common mistakes
- Allele frequency of b = number of bb individuals ÷ population size.Count copies of b: each Bb has one and each bb has two, then divide by twice the number of individuals.
- An unaffected child of two carriers has a ¾ chance of being a carrier.Once we know the child is unaffected the aa box is ruled out, so it is 2 out of the remaining 3: ⅔.
- Non-random mating and inbreeding mean the same thing.Inbreeding is one kind of non-random mating; choosing mates by a trait such as colour or size is non-random mating too.
- If a recessive allele becomes more common, more individuals will show the trait.Not always: the extra copies can sit in carriers, where the dominant allele masks them, so the phenotype stays rare.
Genetic drift in a cup of beans
You need: a cup or mug, 40 dried beans or pasta pieces of one colour or shape, 40 of a different colour or shape, paper and a pen
- Put 20 of each kind in the cup: this is a gene pool of 40 alleles, 20 A and 20 a, so a = 0.5.
- Without looking, draw 10 pieces: these are the alleles of 5 survivors. Count the a pieces and work out the new frequency of a.
- Make a new cup in that ratio, scaled to 40 pieces (for 4 a out of 10, use 16 a and 24 A), and draw 10 again. Repeat for 8 generations, writing a down each time.
- Run it again drawing 30 pieces each generation instead of 10, and compare the two runs.
- Look for: with only 10 pieces drawn, a wanders far from 0.5 and can hit 0 or 1, so an allele is lost for good; with 30 drawn it stays closer to 0.5, because chance matters less in a bigger population.
Safety: Dried beans and small pasta are a choking hazard and raw beans are not to be eaten, so keep them away from small children and do not put any in your mouth.
Your turn
A flock of 40 birds has 20 copies of allele b. What is the frequency of b?
Two unaffected parents have a child with a genetic condition. Is the allele for the condition dominant or recessive?
A flood kills most of a beetle population at random. Which population source is this, and what can happen to the allele frequencies?
Why were Richard Henry's chicks so valuable to Kākāpō Recovery, and which population source does this show?
In the PKU pedigree, what is the chance that individual 8 is a carrier, and how could it be confirmed?
Show answer
1. 40 birds have 80 alleles, so b = 20 ÷ 80 = 0.25. 2. Recessive: each parent must carry it without showing it. 3. Small population size (a bottleneck): allele frequencies change by chance (genetic drift), and rare alleles can be lost. 4. He came from the mainland population, so his chicks carried alleles the Rakiura birds lacked, adding variation; this is like migration (gene flow). 5. ⅔ (her parents 5 and 6 are both Pp and she is unaffected); a DNA test for the p allele would confirm it.
Natural Selection
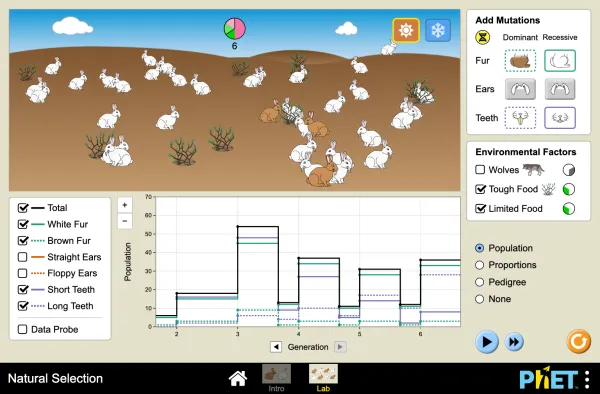
Full screen · PhET Interactive Simulations, University of Colorado Boulder, CC BY 4.0
Recap
- Allele frequency = copies of the allele ÷ total alleles of that gene (two per individual).
- Small populations drift and inbreed, differing survival favours some alleles, migration brings alleles in or takes them out, and non-random mating changes which genotypes appear.
- Pedigrees confirm affected genotypes and the parents of affected children; unaffected children of two carriers have a ⅔ chance of being carriers.
- DNA markers, allele tests and whole-genome sequencing confirm what pedigrees can only estimate; kākāpō are managed with genome data on nearly every bird.
- To evaluate, separate certain from probable, name the assumptions, and say what the findings mean for future generations.
The maths behind it
How is NCEA Level 1 maths going?
See the NCEA Level 1 maths guide