A worked physics investigation: wire length and resistance
What this lesson covers
- Resistance is how strongly a component opposes current, found from R = V ÷ I and measured in ohms.
- How to set up and run a fair test of wire length against resistance, with repeats and an outlier handled properly.
- Turning raw readings into means, uncertainties, a graph, a gradient and an intercept, each with units.
- Why a longer wire has more resistance, using free electrons colliding with metal ions and resistors in series.
- What separates an Achieved, a Merit and an Excellence discussion of the same results.
The question and the physics behind it
- Mr Tuilagi's Year 11 class investigated how the length of a nichrome wire affects its resistance.
- Resistance tells you how hard it is to push a current through something: R = V ÷ I, in ohms (Ω), with V the voltage across it in volts and I the current through it in amps.
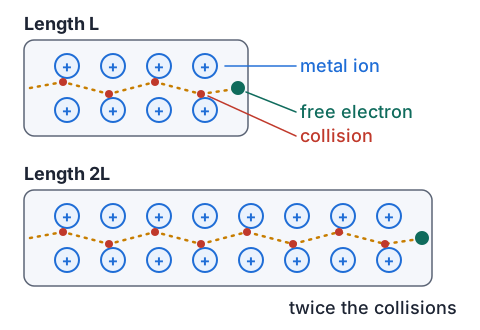
- In a metal, some electrons are free to drift between fixed positive metal ions. A voltage pushes them along, and they keep bumping into the vibrating ions.
- Every collision slows the flow and hands energy to the ions, which is why a wire carrying a current warms up.
- Their prediction: a longer wire gives the electrons more ions to collide with, so doubling the length should double the resistance.
The circuit and the method
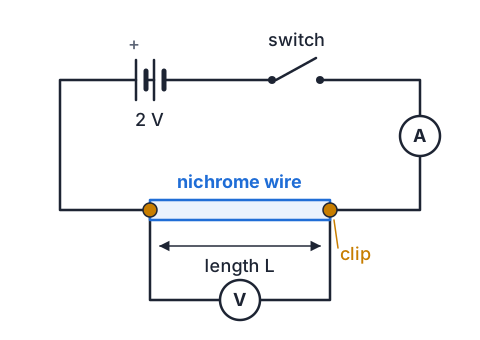
- Independent variable: the length of wire between the crocodile clips, 20 cm to 100 cm in 20 cm steps, read from a metre ruler the wire was taped along.
- Dependent variable: the resistance, worked out from the voltmeter and ammeter readings with R = V ÷ I.
- Controlled variables: the same piece of 0.32 mm nichrome wire, the same 2 V setting on the power pack and the same meters.
- The switch was closed only long enough to read both meters, then opened, so the wire could not heat up between readings.
- Each length was measured three times, unclipping and reclipping the wire each time so that a bad contact would show up as a different result.
Example: the raw results and the outlier
- Every resistance in the table came from a pair of meter readings. The first reading at 20 cm was 1.24 V and 0.40 A.
- At 100 cm the third result, 15.2 Ω, is far from the other two. The group found the clip at the 100 cm end gripping the edge of the tape as well as the wire, a loose contact that adds resistance.
- That reading has a known cause and does not fit, so it is left out of the mean, and the write-up says so.
| Length (cm) | Resistance (Ω): trial 1, 2, 3 | Mean (Ω) | Uncertainty (Ω) |
|---|---|---|---|
| 20 | 3.1, 2.9, 3.0 | 3.0 | ± 0.1 |
| 40 | 5.7, 5.9, 5.8 | 5.8 | ± 0.1 |
| 60 | 8.4, 8.2, 8.3 | 8.3 | ± 0.1 |
| 80 | 11.2, 10.8, 11.0 | 11.0 | ± 0.2 |
| 100 | 14.0, 13.8, 15.2 (outlier) | 13.9 | ± 0.1 |
- R = V ÷ I = 1.24 ÷ 0.40 = 3.1 Ωone reading at 20 cm
- 20 cm: (3.1 + 2.9 + 3.0) ÷ 3 = 9.0 ÷ 3 = 3.0 Ωmean of three repeats
- 20 cm: (3.1 − 2.9) ÷ 2 = ± 0.1 Ωhalf the range
- 15.2 Ω is 1.3 Ω above the others, loose clip
- 100 cm: (14.0 + 13.8) ÷ 2 = 13.9 Ω ± 0.1 Ω
Example: graph, gradient and intercept
- The means were plotted against length and one straight line of best fit drawn through them.
- The points scatter by only about 0.1 Ω either side of the line, no more than the uncertainties, so a straight line is a fair summary.
- The gradient comes from two points far apart on the line: (20 cm, 3.0 Ω) and (100 cm, 13.8 Ω).
- The line does not go through the origin: it meets the resistance axis at 0.3 Ω.
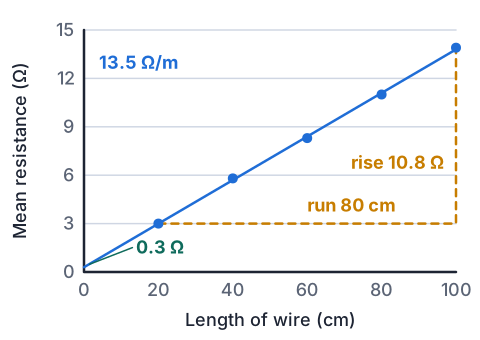
- rise = 13.8 − 3.0 = 10.8 Ωread from the line, not the data
- run = 100 − 20 = 80 cmthe same two points
- gradient = 10.8 ÷ 80 = 0.135 Ω/cm = 13.5 Ω/m× 100 to change per cm into per m
- intercept: 3.0 − 0.135 × 20 = 0.3 Ωwhere the line meets the axis
- R = 13.5 Ω/m × L + 0.3 Ω
Explaining the line with physics
- The gradient means every extra metre of this wire adds 13.5 Ω, or every extra 10 cm adds 1.35 Ω.
- That fits the collision model: each 10 cm of identical wire has the same number of ions in the electrons' path, so it adds the same opposition to the current.
- Another way to see it: a 40 cm wire is two 20 cm wires joined end to end, and resistances in series add, so the wire's own resistance doubles when its length doubles.
- The 0.3 Ω intercept is resistance that does not depend on length: the contacts where the crocodile clips grip the wire, which are in series with it in every reading.
- Take the intercept away and the wire's own resistance is 13.5 Ω/m × L, which is proportional to length, as the class predicted.
The same results at Achieved, Merit and Excellence
- Each step up keeps what the grade below has and adds more processed evidence or more physics, tied together.
| Grade | What the discussion does | Sounds like |
|---|---|---|
| Achieved | Describes resistance and the trend, quoting results | Resistance is how much a wire opposes current. As the length went up from 20 cm to 100 cm, the mean resistance rose from 3.0 Ω to 13.9 Ω. |
| Merit | Explains why, using processed evidence | The graph is a straight line with gradient 13.5 Ω/m, so each extra 20 cm adds about 2.7 Ω. A longer wire has more ions for the free electrons to collide with, so it opposes the current more. |
| Excellence | Integrates the processed evidence with the concepts | See the next example: every number is explained by physics and every physics idea is checked against a number. |
Example: an Excellence discussion
- The graph of mean resistance against length is a straight line, R = 13.5 Ω/m × L + 0.3 Ω, and every mean lies within about 0.1 Ω of it, no more than the uncertainties.
- The constant gradient shows that each equal length of wire adds the same resistance, because each section holds the same number of metal ions for the drifting electrons to collide with; the sections are in series, so their resistances add.
- The 0.3 Ω intercept is not part of the wire: it is the contact resistance at the two clips, present at every length, which is why the line misses the origin. With it removed, the wire's resistance is proportional to its length, confirming the prediction.
- Heating could have raised the resistance, since hotter ions vibrate more and collide with electrons more often. The current was largest in the 20 cm wire, yet that point sits on the line, so switching off between readings kept heating too small to matter.
- The fit lets the class predict: a 1.50 m length should read 13.5 × 1.50 + 0.3 = 20.55 Ω, about 20.6 Ω.
Limitations that strengthen the analysis
- A limitation earns credit when you say how it affected the numbers and what would fix it, not when it is a vague complaint.
- Done well, it shows you understand which physics ideas could spoil the relationship, which is part of analysing the results.
| Limitation | Effect on the results | Fix |
|---|---|---|
| Clips grip with a varying contact | Adds about 0.3 Ω, and more when loose (the 15.2 Ω outlier) | Clean the wire, clip firmly, reclip and repeat |
| Length read to the clip's edge by eye | Each length could be out by a few millimetres | Mark the clip positions on the ruler before starting |
| Wire warms while current flows | Resistance creeps up, most for short lengths | Close the switch only to take the reading; keep the current small |
| Kinks or stretched sections | Thinner spots add extra resistance | Use a fresh, straight piece taped flat |
Common mistakes
- The graph is a straight line, so resistance is proportional to length.The measured line meets the axis at 0.3 Ω, so it is linear; only the wire's own resistance, with the contacts taken away, is proportional.
- A longer wire has more resistance because the electrons get used up on the way.Electrons are not used up, and the current is the same all the way round; they lose energy in more collisions with ions.
- Writing the physics in one paragraph and the results in another.Excellence needs them together: every physics idea should point at a number, and every number should be explained.
- Predicting 1.50 m with the gradient 0.135 and getting 0.5 Ω.0.135 is in Ω per cm, so use 150 cm, or use 13.5 Ω/m with 1.50 m; both give about 20.6 Ω.
A whole investigation with a bouncing ball
You need: a tennis ball or other bouncy ball, a tape measure, masking tape, a phone camera, a clear stretch of hard floor beside a wall
- Tape the tape measure up the wall, starting at the floor.
- Drop the ball from 40 cm (measured to the bottom of the ball) and film it in slow motion if your phone can, to read the top of the first bounce.
- Do three drops at each height of 40, 60, 80, 100 and 120 cm, then find each mean and its uncertainty of half the range.
- Plot mean bounce height against drop height, draw a line of best fit and find its gradient.
- Look for: a straight line close to the origin with a gradient less than 1, because at every bounce some of the ball's energy is transferred to heat and sound, and only a fixed fraction comes back as height.
Safety: Drop only from heights you reach standing on the floor; climbing on a chair to drop from higher is how people get hurt here.
Your turn
At 60 cm one group read 1.66 V across the wire and 0.20 A through it. Find the resistance.
The class added a 70 cm length and got 9.8 Ω, 9.6 Ω and 9.7 Ω. Find the mean and its uncertainty, and say whether it agrees with R = 13.5 Ω/m × L + 0.3 Ω.
Use the line to predict the reading for a 50 cm length.
A student concluded: "When the wire got longer the resistance got bigger because there is more wire." Which grade is this closest to, and what two things would lift it to Merit?
Explain why the class's line meets the resistance axis at 0.3 Ω instead of passing through the origin.
Show answer
1. R = V ÷ I = 1.66 ÷ 0.20 = 8.3 Ω. 2. Mean = (9.8 + 9.6 + 9.7) ÷ 3 = 29.1 ÷ 3 = 9.7 Ω; uncertainty = (9.8 − 9.6) ÷ 2 = ± 0.1 Ω. The line predicts 13.5 × 0.70 + 0.3 = 9.75 Ω, which is inside 9.7 ± 0.1 Ω, so it agrees. 3. R = 13.5 × 0.50 + 0.3 = 6.75 + 0.3 = 7.05 Ω, about 7.1 Ω. 4. Achieved at best: it describes the trend but gives no numbers and no physics. For Merit, add processed evidence (the straight-line graph with gradient 13.5 Ω/m) and explain the cause (a longer wire has more metal ions for the free electrons to collide with). 5. The clips' contacts with the wire add about 0.3 Ω of resistance in series at every length, even a length of zero, so the whole line is lifted by that amount.
Resistance in a Wire
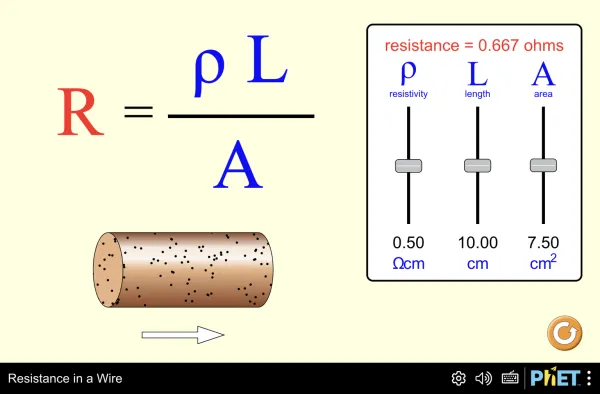
Full screen · PhET Interactive Simulations, University of Colorado Boulder, CC BY 4.0
Recap
- Resistance is found from R = V ÷ I; repeat each length, drop an outlier with a known cause, and give means with half-range uncertainties.
- The class's graph was a straight line: R = 13.5 Ω/m × L + 0.3 Ω.
- The gradient says each metre adds 13.5 Ω, because each equal length has the same number of ions for electrons to collide with, and series resistances add.
- The intercept is the clips' contact resistance; without it, the wire's resistance is proportional to its length.
- Excellence ties each number to the physics that explains it, including why heating and contacts did or did not spoil the result.
| Processed evidence | Value | Physics meaning |
|---|---|---|
| Gradient | 13.5 Ω/m | Resistance added by each metre of wire |
| Intercept | 0.3 Ω | Contact resistance at the clips |
| Largest uncertainty | ± 0.2 Ω | Small next to a 10.9 Ω change, so the trend is real |
| Prediction at 1.50 m | about 20.6 Ω | Uses the line, gradient and intercept together |
The maths behind it
How is NCEA Level 1 maths going?
See the NCEA Level 1 maths guide