A physics investigation: planning and processing evidence
What this lesson covers
- What AS 92045 rewards at Achieved, Merit and Excellence, and why processed evidence matters so much.
- Independent, dependent and controlled variables, and how to choose a sensible range and number of values.
- Repeat readings, means, outliers and uncertainty written as plus or minus half the range.
- Results tables, graphs with a line or curve of best fit, and how to find a gradient with its unit.
- How to tell a proportional, a linear and an inverse relationship apart from a graph or a table.
What this internal is really asking for
- You investigate something physical you can see happen, such as a pendulum swinging, a ball bouncing or a bulb glowing, and you collect numbers about it.
- Achieved: you describe the physics ideas involved and say how one quantity changes with another, pointing at your results.
- Merit: you explain why the relationship happens using physics ideas, and your evidence is processed, not raw: means, calculations, a graph, a gradient.
- Excellence: you weave the processed evidence and the physics together, so every claim is backed by a number and every number is explained.
- So the quality of your processing sets a ceiling on your grade: raw readings alone cannot get past Achieved.
Three kinds of variable
- The independent variable is the one you choose and change on purpose.
- The dependent variable is the one you measure to see how it responds.
- Controlled variables are everything else that could change the result, so you keep them the same and say how.
- Choose at least five values of the independent variable, spread evenly over as wide a range as the equipment allows, so a graph can show the shape of the pattern.
- Ms Rāwiri's Year 11 class asked how the length of a pendulum affects the time for one full swing, called the period.
| Variable | Pendulum investigation | How |
|---|---|---|
| Independent | Length of string | 0.20 m to 1.00 m in 0.20 m steps, measured to the centre of the bob |
| Dependent | Period (one full swing) | Time 10 swings with a stopwatch, divide by 10 |
| Controlled | Mass of the bob | Same 50 g mass hanger every time |
| Controlled | Starting angle | Released from 10° with a protractor at the pivot |
| Controlled | Type of string | Same thin cotton thread, re-tied, not swapped |
Measuring well: repeats and small tricks
- Repeat every reading at least three times, so one slip cannot fool you and you can see how much the results spread.
- Time many swings, not one: your reaction time adds about the same error to the start and stop whatever you time, so spread over 10 swings it matters ten times less per swing.
- Start and stop timing as the bob passes the lowest point, where it moves fastest and the moment is easiest to judge; a mark on the bench below helps.
- Read rulers and protractors at eye level to avoid parallax.
- Write your method as numbered steps that someone else could follow and get the same results.
Example: from raw times to a mean period
- Here are Ms Rāwiri's class's results: the time for 10 swings, three times at each length.
- At 0.60 m one time is far below the other two. A group member admitted they may have counted only 9 swings, and 9 swings of about 1.55 s take about 14.0 s.
- That reading is an outlier: it has a known cause and does not fit, so it is left out of the mean and the reason is written down.
- Work through the 0.60 m row, then check the others the same way.
| Length (m) | 10 swings (s): trial 1, 2, 3 | Mean for 10 swings (s) | Period T (s) |
|---|---|---|---|
| 0.20 | 9.0, 8.8, 9.2 | 9.0 | 0.90 |
| 0.40 | 12.6, 12.8, 12.7 | 12.7 | 1.27 |
| 0.60 | 15.6, 15.4, 14.0 (outlier) | 15.5 | 1.55 |
| 0.80 | 17.9, 18.1, 17.7 | 17.9 | 1.79 |
| 1.00 | 20.0, 20.2, 20.1 | 20.1 | 2.01 |
- 14.0 s is about 1.5 s below the othersspot the outlier
- mean = (15.6 + 15.4) ÷ 2 = 15.5 saverage the trustworthy readings only
- T = 15.5 ÷ 10 = 1.55 sthe time was for 10 swings
- 0.20 m: (9.0 + 8.8 + 9.2) ÷ 3 = 27.0 ÷ 3 = 9.0 s, so T = 0.90 ssame steps, all three kept
- period at 0.60 m = 1.55 s
Uncertainty: how sure is each mean?
- The spread of your repeats tells you how far to trust a mean.
- A simple, accepted measure is half the range: (largest reading minus smallest) ÷ 2.
- At 0.20 m the times run from 8.8 s to 9.2 s, so the range is 0.4 s and the uncertainty is ± 0.2 s for 10 swings.
- Divide by 10 for one swing as well: T = 0.90 ± 0.02 s.
- Give a mean to the same number of decimal places as the readings, or one more at most; writing 0.8966 s claims a precision your stopwatch never had.
- Small uncertainties compared with the change you are measuring mean the pattern in your results is real, which is a strong point to make in a discussion.
Graph the means, then draw a line of best fit
- Put the independent variable on the horizontal axis and the dependent variable on the vertical axis, each labelled with its quantity and unit.
- Choose scales that use most of the grid, going up in even steps such as 0.2 or 0.5.
- Plot the means as small dots or crosses.
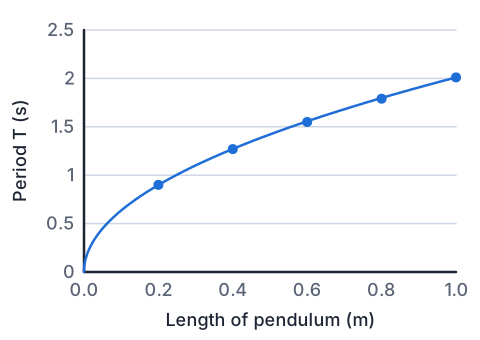
- Draw one smooth line or curve of best fit with roughly as many points above it as below; never join the dots point to point.
- The class's points make a curve: the period grows with length, but by less for each extra 0.20 m. That shape is your first piece of evidence about the relationship.
Proportional, linear or inverse?
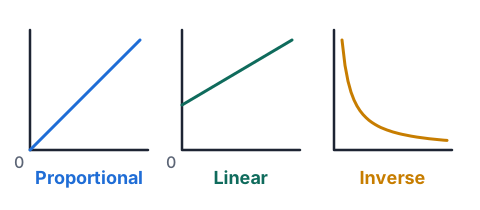
- Proportional: a straight line through the origin. Double one quantity and the other doubles, and y ÷ x stays the same.
- Linear: a straight line that does not go through the origin. Each equal step in x adds the same amount to y, but doubling x does not double y.
- Inverse: a falling curve that never reaches either axis. Double x and y halves, so x × y stays the same.
- Test a claim with the numbers as well as the shape: work out y ÷ x or x × y for every row and see if it stays roughly constant.
- If the graph is a curve that is not inverse, it may still hide a simple rule, as the next example shows.
| Relationship | Graph | Number test |
|---|---|---|
| Proportional | Straight line through (0, 0) | y ÷ x about constant |
| Linear | Straight line, crosses the y axis away from 0 | Equal steps in x give equal steps in y |
| Inverse | Falling curve, levels off | x × y about constant |
Example: straightening the pendulum curve
- Doubling the length from 0.20 m to 0.40 m multiplies the period by 1.27 ÷ 0.90 = 1.41, not 2, so T is not proportional to L.
- Quadrupling the length from 0.20 m to 0.80 m almost exactly doubles the period (0.90 s to 1.79 s), which hints that T² might be proportional to L.
- So the class squared each period and plotted T² against length.
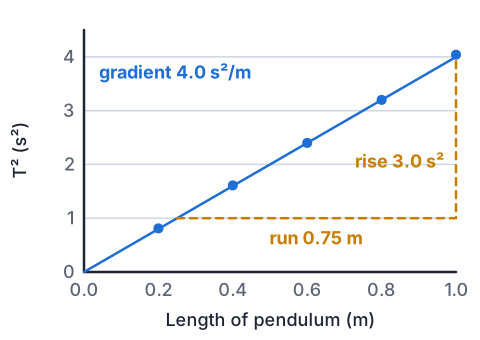
- The points now lie close to a straight line through the origin, so T² is proportional to L.
- Find the gradient from two points far apart on the line, not from two data points.
| Length (m) | 0.20 | 0.40 | 0.60 | 0.80 | 1.00 |
|---|---|---|---|---|---|
| T (s) | 0.90 | 1.27 | 1.55 | 1.79 | 2.01 |
| T² (s²) | 0.81 | 1.61 | 2.40 | 3.20 | 4.04 |
- 1.27² = 1.6129 ≈ 1.61 s²square each period, keep 2 decimal places
- the line passes through (0.25 m, 1.0 s²) and (1.00 m, 4.0 s²)two points on the best-fit line, far apart
- gradient = rise ÷ run = (4.0 − 1.0) ÷ (1.00 − 0.25) = 3.0 ÷ 0.75 = 4.0 s²/munits are the y unit over the x unit
- T² = 4.0 × L, so T² is proportional to L
- physics predicts T² = 4π²L ÷ g, gradient 4π² ÷ 9.8 ≈ 4.0 s²/mthe class's result agrees with theory
What processing looks like at each grade
- The same results can be written up at three levels. The difference is how much processed evidence is used and how well it is tied to physics.
| Grade | A statement about the pendulum |
|---|---|
| Achieved | As the string got longer the pendulum took longer to swing: at 0.20 m the period was 0.90 s and at 1.00 m it was 2.01 s. |
| Merit | The period increased with length but not in proportion: quadrupling the length from 0.20 m to 0.80 m only doubled the period. A longer pendulum's bob travels a longer arc, while the pull of gravity along its path is no stronger, so each swing takes longer. |
| Excellence | Plotting T² against L gave a straight line through the origin with gradient 4.0 s²/m, matching the 4π² ÷ g that physics predicts, so T² is proportional to L. The uncertainties (± 0.02 s at most) are far smaller than the changes in T, so the pattern is real. |
Common mistakes
- Joining each point to the next with a ruler to make a zigzag graph.Draw one smooth line or curve of best fit through the trend; data points scatter a little around the true pattern.
- The graph goes up in a straight line, so the quantities are proportional.Proportional needs a straight line through the origin; a straight line that cuts the axis elsewhere is only linear.
- Averaging all three repeats, including the reading that was clearly a mistake.Leave an outlier with a known cause out of the mean, and record in your write-up which reading you dropped and why.
- Gradient = 4.0, with no unit.A gradient has the y unit over the x unit, here s²/m, and it means something physical, so always write and explain the unit.
Time a home-made pendulum
You need: about 1 m of string or cotton thread, a bunch of keys or a heavy metal nut, sticky tape, a tape measure, a phone timer, a table to hang it from
- Tie the keys to the string and tape the other end firmly to the edge of a table so the keys hang freely, with 0.20 m from the tape to the middle of the keys.
- Pull the keys a short way to one side, about a hand's width, let go, and time 10 full swings. Do it three times and find the mean.
- Repeat for lengths of 0.30 m, 0.40 m, 0.50 m and 0.60 m, retaping the string each time so the keys never touch the floor.
- Divide each mean by 10 to get the period, square it, and plot T² against length on graph paper.
- Look for: the points fall close to a straight line through the origin, with a gradient near 4 s²/m, just as Ms Rāwiri's class found.
Safety: Swinging keys can hit a face or knock over a glass, so clear the space around the pendulum and keep heads out of its path.
Your turn
A class drops a tennis ball from different heights and measures how high it bounces. Name the independent variable, the dependent variable and two controlled variables.
A group timed 10 swings of a pendulum as 14.2 s, 14.4 s and 12.9 s, and they think they miscounted once. Find the mean period and its uncertainty.
A spring's total length was measured with masses from 0 g to 300 g hung on it. The best-fit line passes through (0 g, 12.0 cm) and (300 g, 18.0 cm). Find the gradient, and say whether length is proportional to mass.
A class measured the current through different resistors from the same battery pack: 10 Ω gave 0.59 A, 20 Ω gave 0.30 A, 30 Ω gave 0.20 A and 40 Ω gave 0.15 A. Name the relationship and give the evidence.
Explain why timing 10 swings and dividing by 10 gives a better period than timing one swing.
Show answer
1. Independent: drop height. Dependent: bounce height. Controlled, for example: the same ball, the same floor surface, measuring both heights to the bottom of the ball. 2. 12.9 s is the outlier (about one swing short), so the mean is (14.2 + 14.4) ÷ 2 = 14.3 s and the period is 1.43 s. Half the range is (14.4 − 14.2) ÷ 2 = 0.1 s for 10 swings, so T = 1.43 ± 0.01 s. 3. Gradient = (18.0 − 12.0) ÷ (300 − 0) = 0.020 cm/g, or 2.0 cm per 100 g. The relationship is linear but not proportional, because the line crosses the length axis at 12.0 cm, not at 0. 4. Inverse: resistance × current stays about the same (10 × 0.59 = 5.9, 20 × 0.30 = 6.0, 30 × 0.20 = 6.0, 40 × 0.15 = 6.0), so doubling the resistance halves the current. 5. Reaction time adds about the same error when starting and stopping however long you time for, so spread over 10 swings it is ten times smaller per swing, and the percentage uncertainty in the period drops.
Pendulum Lab
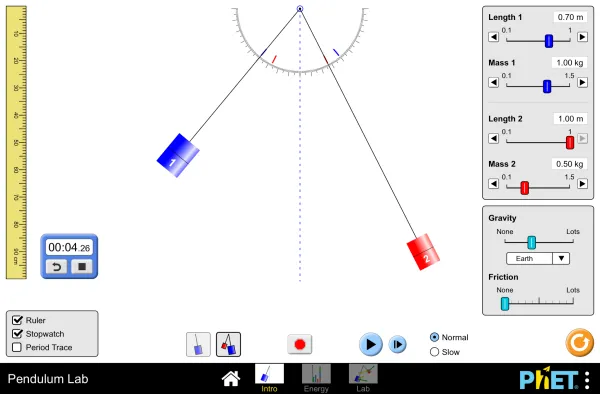
Full screen · PhET Interactive Simulations, University of Colorado Boulder, CC BY 4.0
Recap
- Change one variable, measure one, and keep the rest the same, saying how.
- Take at least five values over a wide range, each repeated three times.
- Leave out an outlier with a known cause, find the mean, and give an uncertainty of half the range.
- Graph the means with a smooth line of best fit, then use the shape and a gradient with units to name the relationship.
- Processed evidence tied to physics is what moves a report from Achieved to Merit and Excellence.
| Idea | Rule |
|---|---|
| Mean | Add the trustworthy repeats, divide by how many |
| Uncertainty | ± (largest − smallest) ÷ 2 |
| Gradient | rise ÷ run from two far-apart points on the line, with units |
| Proportional | Straight line through the origin |
| Linear | Straight line, not through the origin |
| Inverse | x × y about constant |
The maths behind it
How is NCEA Level 1 maths going?
See the NCEA Level 1 maths guide