Scatter plots: 7 questions solved step by step

What this lesson covers
- A scatter plot shows whether two numerical variables change together, and how closely.
- An association between two variables does not show that one causes the other.
7 questions, one data set
- An Ōrewa dairy, 10 summer days.
- Across: maximum temperature (°C).
- Up: ice creams sold that day.
- Answer in context, with units.
| °C | Sold | °C | Sold |
|---|---|---|---|
| 18 | 16 | 24 | 25 |
| 19 | 15 | 26 | 12 |
| 20 | 19 | 27 | 34 |
| 22 | 20 | 28 | 33 |
| 23 | 25 | 30 | 37 |
Question 1 · Achieved
- Describe the trend in context.
- Quote values from the data.
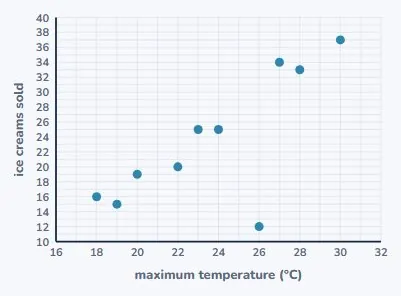
Q1: the trend
- Read the whole cloud.
- Say "tend": not every day.
- 18 °C: 16 ice creams sold
- 30 °C: 37 ice creams sold
- cloud rises left to rightbottom left to top right
- direction: positive
- Hotter days: sales tend to rise
Question 2 · Achieved
- Describe the strength and scatter.
- Name any unusual point.
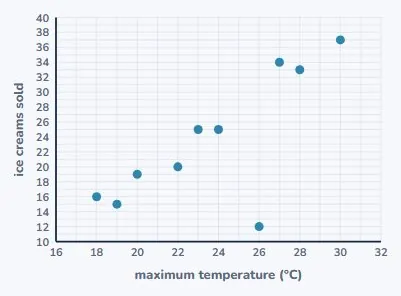
Q2: strength and scatter
- Strong: close to a line.
- Unusual: keep it, explain.
- 9 of 10 dots near a straight line
- strength: strong; form: linear
- scatter: even from 18 to 30 °C
- unusual: 26 °C, only 12 sold
- 24 °C: 25 sold; 27 °C: 34 sold
- 12 is less than half of 25
- keep it: rain? closed early?
- Strong, linear, 1 unusual day
Question 3 · Merit
- A trend line drawn by eye passes
- through (18, 14) and (30, 38).
- Find its equation. What does
- the gradient mean in context?
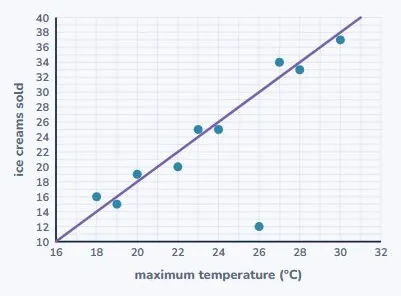
Q3: the trend line
- Gradient = rise ÷ run.
- Then substitute for c.
- m = (38 − 14) ÷ (30 − 18)rise ÷ run
- = 24 ÷ 12 = 2
- y = 2x + c
- 14 = 2 × 18 + cuse (18, 14)
- 14 = 36 + c, so c = −22
- y = 2x − 22
- 2 × 30 − 22 = 38the other point
- about 2 more sold per extra 1 °C
- c = −22: no meaning at 0 °C
Question 4 · Merit
- Use y = 2x − 22 to predict sales
- on a 25 °C day.
- Interpolation or extrapolation?
- How reliable is it?
Q4: predict for 25 °C
- Substitute x = 25.
- Then check the range.
- y = 2 × 25 − 22
- = 50 − 22 = 28
- data: 18 °C to 30 °C
- 25 °C is inside: interpolation
- strong, dots close to the line
- but only 10 days, one dairy
- About 28 ice creams sold
Question 5 · Merit, in context
- A winter day has a maximum of 6 °C.
- Use y = 2x − 22 to predict sales.
- Does the prediction make sense?
Q5: predict for 6 °C
- Calculate, then question it.
- No winter days in the data.
- y = 2 × 6 − 22
- = 12 − 22 = −10
- −10 ice creamssales cannot be negative
- 6 °C is outside 18 to 30 °C
- extrapolation: no winter data
- The line cannot predict winter
Question 6 · Excellence
- The owner says the 26 °C day
- proves the trend line is useless.
- Use the line to evaluate her claim.
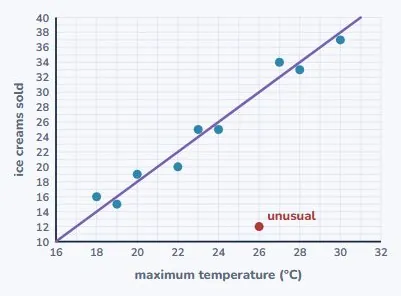
Q6: is the line useless?
- Predicted versus actual.
- Compare the other days.
- 2 × 26 − 22 = 30predicted
- 12 − 30 = −18actual − predicted
- other 9 days: within 2 of line
- 24 °C: line 26, sold 25
- 27 °C: line 32, sold 34
- 1 day far off, 9 days close
- "The line is useless"fits 9 days of 10
- The line fits normal days well
Question 7 · Excellence
- A medical centre near the beach saw
- more sunburn on high-sales days.
- "Ice creams cause sunburn."
- Evaluate the claim.
Q7: association or cause?
- Look for a third variable.
- Associated is not caused.
- sales and sunburn rise together
- that is an association
- third variable: hot, sunny days
- sun means more ice creams sold
- sun means more sunburn cases
- "Ice creams cause sunburn"not shown by this data
- observational, not an experiment
- Associated with, not caused by
What answered all seven
- Describe, fit, predict, judge, and never claim a cause.
| Step | How |
|---|---|
| Direction | positive, negative or none |
| Strength | how close dots are to a line |
| Unusual | name it, keep it, give a reason |
| Line | gradient first, then c |
| Predict | inside the data: interpolate |
| Outside | extrapolation: do not trust |
| Cause | say "associated with" |
Is your child on track?
Take the free placement test