Five investigative approaches and the question each one answers
What this lesson covers
- One context and one big question, split into sub-questions that each suit a different approach.
- Fair testing, pattern seeking, exploring and observing, classifying and identifying, and modelling, and the kind of question each answers best.
- Kinds of evidence: experimental and observational data, statistics, surveys, and wider knowledge such as mātauranga shared at a wānanga.
- What each approach can and cannot show, including why a pattern on its own does not prove a cause.
- How to write the purpose of an approach (Achieved) and an evidence-based reason it did or did not fit (Merit).
One context, one big question
- For this internal you choose one context, such as a local stream, a patch of bush or the sea around Aotearoa, and ask one overarching question about it.
- You then break the big question into smaller sub-questions, and each one is answered with a different investigative approach.
- You need at least three different approaches; you can carry them out yourself or work with data other scientists have gathered.
- Everything you claim is backed by evidence from your own investigations: numbers, observations, and the names of what you identified.
- Achieved describes what each approach is for, with evidence. Merit explains, with evidence, why each approach did or did not suit its sub-question. Excellence analyses how the approaches together build one picture of the context.
The five approaches and their questions
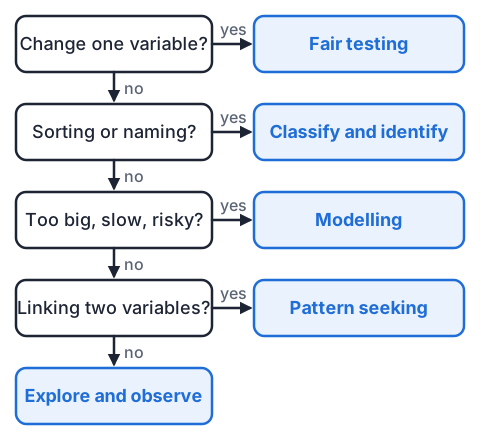
- Each approach is good at one kind of question, so the question decides the approach, not the other way round.
- If you can change one thing yourself and keep everything else the same, run a fair test.
- If you need to sort living things or objects into groups, or put a name to one, classify and identify.
- If the thing is too big, too slow, too far away or too risky to test directly, build or use a model.
- If you cannot control the variables but can measure many cases, look for a pattern; and if you are meeting something new and do not yet know what matters, explore and observe.
| Approach | Question it answers best | Stream example |
|---|---|---|
| Fair testing | Does changing X change Y? | Does adding fertiliser make algae grow faster in jars of stream water? |
| Pattern seeking | Is there a link between X and Y? | Do streams with more forest upstream have more mayflies? |
| Exploring and observing | What is here, and what happens? | What lives along the bank, and how fast does the water flow? |
| Classifying and identifying | What is it, and which group is it in? | Which insects in the net are mayflies, stoneflies or caddisflies? |
| Modelling | What would happen if...? | How much soil washes off a bare bank compared with a planted one, using trays of soil? |
Fair testing
- A fair test changes one variable on purpose (the independent variable) and measures what happens to another (the dependent variable).
- Every other variable that could affect the result is kept the same; these are the controlled variables.
- Repeating each test at least three times and taking the mean makes the result more reliable and shows up any odd result.
- Its great strength is that it can show cause and effect.
- Its weakness is that the real world, such as a whole river, can rarely be controlled like that, so fair tests usually happen on a small scale, in jars or trays.
Pattern seeking
- Pattern seeking looks for a relationship between two variables that you cannot control, by measuring or collecting many cases.
- It suits rivers, weather, oceans and populations, where changing one variable on purpose is impossible or would do harm.
- A pattern needs plenty of data, often from many years or many sites, and shows up best on a graph.
- A pattern shows that two things change together; on its own it does not prove that one causes the other, because a third factor might drive both.
- Knowledge built over generations can come from pattern seeking too: the maramataka, the Māori lunar calendar, draws on long observation of how fish, birds and plants behave through the phases of the Moon.
Example: is the sea around Aotearoa becoming more acidic?
- Nobody can control the ocean, so NIWA scientists have measured the sea off the Otago coast, on the Munida Transect, since 1998. It is the longest-running pH record in the Southern Hemisphere.
- Between 1998 and 2020 the dissolved carbon dioxide went up and the pH went down.
- The pattern: as more carbon dioxide dissolves in the sea, the water becomes more acidic.
- Pattern seeking suited this question because the variables cannot be controlled and the change is so small that it only shows across more than 20 years of measurements.
| Measure | 1998 | 2020 | Change |
|---|---|---|---|
| pH | 8.092 | 8.057 | 0.035 lower, so 8.6% more acidic |
| Dissolved CO₂ (pCO₂, µatm) | 349.9 | 384.9 | 10.0% higher |
Exploring and observing
- Exploring and observing is for meeting something new: finding out what is there and what happens, before you know which variables matter.
- You look closely, sketch, photograph, take notes, and measure things like temperature, light or flow speed, often with tools that extend your senses, such as a hand lens, a light meter or a data logger.
- It is often the first step, because what you notice raises the questions that the other approaches then go on to answer.
- Its weakness is that one visit is a snapshot, so what you record can depend on the day, the weather or the time.
Classifying and identifying
- Classifying sorts things into groups by features they share; identifying uses those features to name one particular thing.
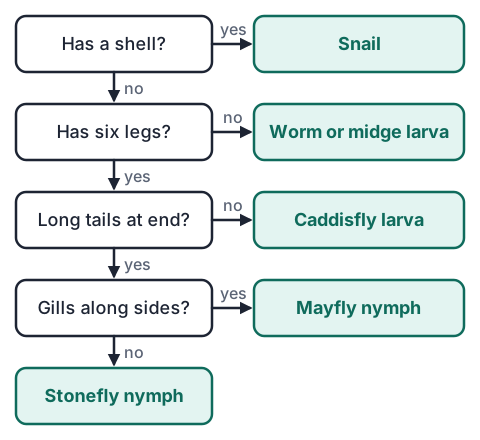
- A dichotomous key does both with a chain of two-way choices, each about one feature you can see.
- In a stream, a key separates mayfly, stonefly and caddisfly larvae, which are sensitive to pollution, from worms and midge larvae, which survive in much poorer water.
- Mātauranga Māori holds its own detailed naming and grouping of plants, fish and birds by their features, uses and seasons, shared by iwi and hapū on their terms.
- Its strength is that it turns a jumble of finds into data you can count; its weakness is that one wrong choice early in a key leads to a wrong name.
Modelling
- A model is a simpler version of something that is too big, too small, too slow, too far away, too dangerous or too costly to study directly.
- Models can be physical (a tray of soil standing in for a hillside), drawn (a food web), mathematical (an equation) or run on a computer (climate projections).
- You use a model to test an idea or to predict what could happen, such as what heavy rain does to a bare bank compared with a planted one.
- Every model leaves things out, so its predictions need checking against the real thing, and your write-up should say what your model left out.
Kinds of evidence
- Whatever the approach, your write-up needs evidence: actual numbers, names and observations from your investigation, quoted.
- Different approaches produce different kinds of evidence, and the standard accepts all of those below.
- If you use knowledge shared at a wānanga or by kaumātua, ask permission first, record it accurately, and acknowledge who shared it.
| Evidence | What it is | Example |
|---|---|---|
| Experimental data | Measurements from a test you set up | Mass of algae in jars with 0, 2 and 4 drops of fertiliser |
| Observational data | Records of what you saw or measured without changing anything | A sketch map of the stream with the water temperature at three spots |
| Statistics | Large data sets, often from agencies, summed up as means, trends or percentages | NIWA's pH record off Otago from 1998 to 2020 |
| Surveys | Answers from many people, collected the same way each time | Asking 30 neighbours whether the stream has changed in their lifetime |
| Wider knowledge | Experts, published science, and mātauranga such as that shared at a wānanga | Kaumātua describing which kai the awa once gave, and in which season |
Example: from Achieved to Merit
- A class asked: does shade from streamside trees keep the water cooler? At 2 pm on one day they took three temperature readings in a shaded stretch and three in an open stretch.
- Their means were 14.5 °C in the shade and 18.0 °C in the open.
- Achieved names the approach, says what that approach is for, and quotes the evidence.
- Merit adds a reason, tied to that evidence, why the approach fitted the question, and says what it could not show.
| Grade | What the student wrote |
|---|---|
| Not yet | We measured the temperature and the shade was colder. |
| Achieved | We used pattern seeking, which looks for a link between variables we cannot control. The shaded stretch was cooler, 14.5 °C against 18.0 °C. |
| Merit | Pattern seeking fitted because we could not control the stream: depth, flow and sunlight all varied along it. Comparing two measured stretches showed a link (3.5 °C cooler in shade), but it cannot prove the shade caused it, since the shaded stretch was also deeper. |
Example: when an approach did not fit
- Merit also rewards honesty: an approach that did not suit its question, explained with evidence, still earns credit.
- A class wanted to show that carbon dioxide is making the sea more acidic. They blew through a straw into tap water with bromothymol blue indicator, and it turned from blue to yellow.
- Strong answer: exploring and observing showed that carbon dioxide makes water more acidic, because the indicator went from blue to yellow.
- But it only partly fitted the question about the sea: tap water is not seawater, which resists changes in pH, and breath holds far more carbon dioxide than the air above the ocean.
- So the Munida statistics, or a model using real seawater and air-level carbon dioxide, would answer the sea question better.
Common mistakes
- Every investigation is a fair test, so each one needs an independent and a dependent variable.Only fair testing changes one variable on purpose; the other four approaches answer different kinds of question.
- The graph shows pH falling as CO₂ rises, so this proves CO₂ causes it.A pattern shows a link, not a cause; you need a fair test, a model or known chemistry as well to argue the cause.
- Pattern seeking was appropriate because we were looking for patterns.That only repeats the name; give the reason with evidence, such as the ocean cannot be controlled, so 23 years of measured data was the only way to see the trend.
- Surveys and things said at a wānanga are not real science, so I left them out.Surveys, statistics and wider knowledge, including mātauranga shared at a wānanga, all count as evidence when used with care and acknowledged.
Put a paper towel claim to a fair test
You need: two brands of paper towel, a measuring jug, water, scissors, a dinner plate, pen and paper
- Write a claim from the pack, such as 'super absorbent', as a fair-test question: does the brand change how much water one sheet soaks up?
- Cut every sheet to the same size if the brands differ, and fold each one into quarters the same way.
- Fill the jug to 200 mL, hold a sheet under the water for 10 seconds, lift it out and let it drip back for 10 seconds, then put it on the plate and read the jug.
- Work out the water soaked up (200 mL minus what is left), refill to 200 mL, and test three sheets of each brand, then find each brand's mean.
- Look for: which brand holds more, how close your three repeats are, and the variables you kept the same (size, folding, soak time, drip time) that make it a fair test.
Safety: Spilt water makes a kitchen floor slippery, so work at the bench over a tray or the sink and wipe up drips straight away.
Your turn
Which approach best answers: which of the beetles caught in pitfall traps in the school bush are native?
Which approach best answers: do kererū visit gardens more often in the months when more trees are fruiting?
A student tests whether the slope of a tray of soil changes how much soil washes off when 500 mL of water is poured over it. Name the independent variable, the dependent variable and one controlled variable.
Explain why modelling, not a fair test, is the right approach for predicting how a 1 m rise in sea level would affect a coastal town.
A student wrote: 'Exploring and observing was appropriate because we explored and observed the stream.' Say why this is not yet Merit, and what it needs.
Show answer
1. Classifying and identifying: each beetle is named with a key or guide and sorted into native or introduced. 2. Pattern seeking: the number of visits and the amount of fruit both vary on their own and cannot be controlled, so you look for a link across many months. 3. Independent: the slope (angle) of the tray. Dependent: the amount (mass) of soil washed off. Controlled, for example: the 500 mL of water, how fast it is poured, the type and amount of soil. 4. The sea cannot be raised to test it, and the change is too big and too far in the future, so a model (a map or computer model of the town and its land heights) is used to predict it. 5. It only repeats the approach's name; it needs a reason the approach suited the question, backed by evidence from the investigation, such as what was found and measured on the visit.
Recap
- One context and one big question, split into sub-questions, each answered by a different approach.
- Fair testing finds cause and effect; pattern seeking finds links you cannot control; exploring and observing finds out what is there; classifying and identifying names and groups; modelling studies what is too big, slow or risky.
- A pattern is a link, not proof of a cause.
- Evidence can be experimental, observational, statistics, surveys or wider knowledge, and every claim quotes it.
| Grade | What you do for each approach |
|---|---|
| Achieved | Say what the approach is for, with your evidence |
| Merit | Explain with evidence why it did or did not suit its question |
| Excellence | Analyse how the approaches together answer the big question |
The maths behind it
How is NCEA Level 1 maths going?
See the NCEA Level 1 maths guide