Combining approaches: one stream investigated three ways
What this lesson covers
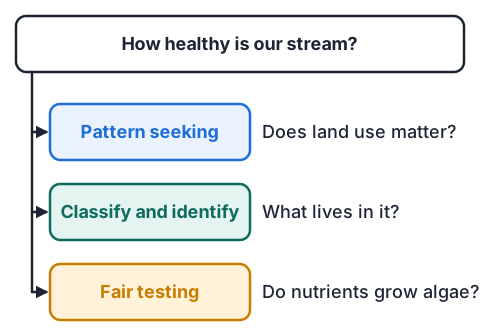
- Planning one context as an overarching question with three sub-questions, each matched to an approach.
- Pattern seeking with council stream data, and reading Macroinvertebrate Community Index (MCI) scores.
- Classifying and identifying stream invertebrates, and what the share of mayflies, stoneflies and caddisflies says about water quality.
- Fair-test variables, the control, repeats, means and odd results.
- How the approaches fit together, and how to write the analysis for Merit and Excellence.
The plan: one big question, three sub-questions
- A Year 11 class in Auckland chose the stream below their school. Overarching question: how healthy is our stream, and what is affecting it?
- Sub-question 1, pattern seeking: across Auckland, are streams with towns upstream less healthy than streams with forest upstream?
- Sub-question 2, classifying and identifying: which invertebrates live in our stream, and are they the kinds that need clean water?
- Sub-question 3, fair testing: does adding nutrients make algae grow faster in our stream water?
- Each sub-question was chosen so its answer feeds the big question, and so it suits the approach used to answer it.
Investigation 1: pattern seeking with council data
- Auckland Council samples the invertebrates in about 60 streams every summer and turns each sample into a Macroinvertebrate Community Index (MCI) score: animals that need clean water raise the score, tolerant ones lower it.
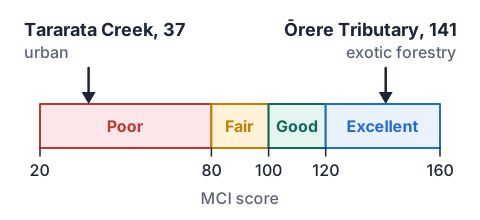
- Over 2021 to 2025, scores ranged from 37, at two urban streams, Tararata Creek and Ōtara Creek (East), to 141 at Ōrere Tributary, in an exotic forestry catchment.
- Nine of the ten worst-ranked sites overall were in urban catchments.
- The pattern: the more town there is upstream, the poorer the stream's health tends to be.
- Pattern seeking fits because nobody can build a town upstream of a stream to test it, but dozens of real streams can be compared.
| MCI score | Class | What it suggests |
|---|---|---|
| above 119 | Excellent | Excellent water and habitat quality |
| 100 to 119 | Good | Possible mild pollution |
| 80 to 99 | Fair | Probable mild pollution |
| below 80 | Poor | Probable severe pollution |
Investigation 2: classifying and identifying what lives there
- The class kick-netted three riffles for one minute each, tipped the catch into white trays and used a key to identify each animal to its group.
- They found nine kinds of animal, and only two were EPT kinds (mayflies, stoneflies or caddisflies), the groups most sensitive to pollution.
- Percentage of EPT kinds = 2 ÷ 9 × 100 ≈ 22%. For comparison, the best Auckland site, Ōrere Tributary, reached 69%.
- Using the tolerance scores on their identification sheet, they calculated an MCI of 86, which is in the Fair class.
- Classifying and identifying fits because the health of a stream is judged from which animals live in it, and that needs every animal named and grouped correctly.
| Animal | EPT? | Number caught |
|---|---|---|
| Mud snails | No | 64 |
| Midge larvae | No | 48 |
| Worms | No | 31 |
| Amphipods | No | 22 |
| Water boatmen | No | 9 |
| Damselfly larvae | No | 6 |
| Caddisfly larvae | Yes | 5 |
| Leeches | No | 4 |
| Mayfly nymphs | Yes | 3 |
Investigation 3: planning the fair test
- Question: does the amount of fertiliser change how much algae grows in our stream water?
- Independent variable (changed): drops of liquid plant fertiliser in each 500 mL jar: 0, 2, 4 or 8.
- Dependent variable (measured): the mass of algae after 10 days, filtered out, dried and weighed in milligrams.
- Controlled variables (kept the same): the same stream water sample, volume, jar type, window sill, light and time.
- The 0-drop jars are the control: they show how much algae grows from the stream water alone, so any extra can be put down to the fertiliser.
- Three jars at each amount are the repeats, so an odd jar shows up and the mean is more reliable.
Example: processing the fair-test results
- The class's dry algae masses are in the table. One 4-drop jar gave 33 mg, nearly twice its repeats.
- They checked their notes: that jar had been knocked to the sunny end of the sill, so it broke a controlled variable.
- Find the mean for each amount, deciding what to do with the odd jar.
| Drops of fertiliser | Jar 1 (mg) | Jar 2 (mg) | Jar 3 (mg) | Mean (mg) |
|---|---|---|---|---|
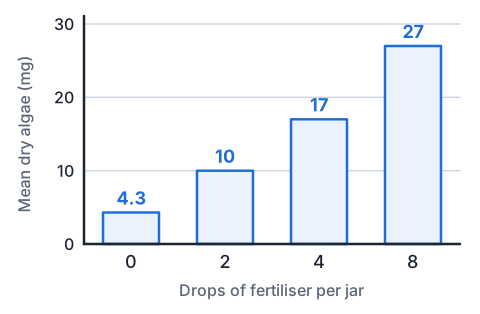
| 0 | 4 | 5 | 4 | 4.3 |
| 2 | 9 | 11 | 10 | 10 |
| 4 | 18 | 16 | 33 (left out) | 17 |
| 8 | 26 | 28 | 27 | 27 |
- 0 drops: (4 + 5 + 4) ÷ 3 = 4.3 mgadd the repeats, divide by how many
- 4 drops: (18 + 16) ÷ 2 = 17 mg33 mg left out, with the reason recorded
- 4 drops with the odd jar: (18 + 16 + 33) ÷ 3 = 22.3 mgone faulty jar would push the mean up by 5 mg
- 27 ÷ 4.3 ≈ 68 drops against the control
- more fertiliser, more algae: about six times as much with 8 drops as with none
Putting the three together
- Each investigation answers its own sub-question, but the big question needs them linked.
- Pattern seeking showed that Auckland's urban streams score lowest, so the class expected their own urban stream to struggle.
- Classifying and identifying confirmed it for their stream: an MCI of 86 (Fair) and only 22% EPT kinds, with mostly tolerant snails, midges and worms.
- The fair test pointed to one likely cause: nutrients, like those in fertiliser washing off gardens and streets, gave about six times as much algae in the jars.
- Together they say the stream is in fair health and nutrient runoff is a likely reason; no single approach could show both what is wrong and why.
- The gaps show too: the fair test was in jars, and the council pattern comes from other streams, so the next step is to measure nutrient levels in this stream itself.
Adding wider knowledge
- The class also met a kaumātua from the local marae and a member of the stream care group, with their teacher arranging the visit.
- The kaumātua described the awa of her childhood, with clear water and plenty of kōura and tuna, and spoke of the kaitiakitanga her whānau hold for it.
- This is evidence of change over a lifetime that no single summer of sampling could give, and it agrees with the council pattern.
- Knowledge shared like this is used only in the way the person agreed, acknowledged by name if they wish, and never reduced to a single number.
Example: writing the analysis for Merit and Excellence
- Achieved describes what the approach is for, with evidence.
- Merit explains, with evidence, why the approach suited its sub-question, and names what it could not do.
- Excellence analyses the links: how one finding led to, supported or limited another, quoting numbers from each investigation, and what the approaches together say about the big question.
| Grade | What the student wrote |
|---|---|
| Achieved | Classifying and identifying is used to name living things and sort them into groups. We used a key and found nine kinds of invertebrate; only two (mayflies and caddisflies) were EPT. |
| Merit | Classifying and identifying suited our question because a stream's health is judged by which animals live in it, so each had to be named. Our list gave an MCI of 86 (Fair). It could not tell us why the score was low, which is why we added a fair test. |
| Excellence | The council pattern (urban streams as low as 37, a forestry stream at 141) told us what to expect; our MCI of 86 and 22% EPT showed our stream fits it; and the fair test, with algae rising from 4.3 mg to 27 mg as fertiliser went from 0 to 8 drops, suggested nutrient runoff as one reason. Each approach filled a gap in another, so together they answer how healthy the stream is and why, though nutrients in the stream itself still need measuring. |
Common mistakes
- My controlled variable is the amount of fertiliser.That is the independent variable, the one you change; controlled variables are kept the same, such as water volume, light and temperature.
- I included the odd jar in the mean so all my data counts.If a result is far from its repeats and you can find why (the jar was moved into the sun), leave it out of the mean and say so.
- The fair test proves fertiliser is what is wrong with the stream.It shows nutrients increase algae in jars; to claim it for the stream you need nutrient readings from the stream itself.
- For Excellence I wrote a summary of each investigation again.Excellence analyses the links: how one finding led to, supported or limited another, with evidence from each.
Model a riverbank in a storm
You need: two shallow takeaway containers, garden soil, a clump of grass with its roots and soil, a measuring jug, water, two clear glasses, a thick book, scissors
- Cut a small notch in one short end of each container. Fill one with bare garden soil and the other with the grass clump, both pressed level and to the same depth.
- Rest the other end of each container on the book so both slope at the same angle, with the notch over a glass.
- Pour 250 mL of water slowly over the high end of each container, at the same speed, so the runoff drains through the notch into the glass.
- Leave the glasses for 10 minutes, then compare their colour, cloudiness and the layer of soil settled at the bottom.
- Look for: the bare soil gives much muddier runoff, because roots hold soil in place and leaves slow the water. That is modelling a streambank, and keeping the slope, water and pouring speed the same makes it a fair test too.
Safety: Potting mix can carry Legionella bacteria that cause a serious lung infection, so use garden soil instead, keep it damp so no dust rises, and wash your hands well afterwards.
Your turn
Three repeats of a fair test give 12 mg, 14 mg and 13 mg of algae. Find the mean.
A stream has an MCI of 104. Which class is it in?
A class identifies 12 kinds of invertebrate, and 3 of them are EPT kinds. Work out the percentage of EPT kinds.
In the fertiliser test, which jars are the control, and what are they for?
Give one thing the council data could not tell the class, which their own classifying and identifying could.
Write one sentence that links the pattern seeking and the classifying and identifying, with evidence, as an Excellence answer would.
Show answer
1. (12 + 14 + 13) ÷ 3 = 13 mg. 2. Good (100 to 119). 3. 3 ÷ 12 × 100 = 25%. 4. The 0-drop jars; they show how much algae grows from the stream water alone, so the extra growth in the other jars can be put down to the fertiliser. 5. How healthy their own stream is: which animals actually live in it, and its own MCI. 6. For example: the council data showed urban streams score as low as 37, which led us to check our own urban stream, and its MCI of 86 with only 22% EPT kinds confirmed it follows the same pattern.
Recap
- Split one overarching question into sub-questions that each suit an approach.
- Fair tests need one independent variable, a measured dependent variable, controlled variables, a control and repeats.
- Leave an odd result out of the mean only when you can say why, and record it.
- Excellence links the approaches: what each showed, how it led to or limited another, and what they say together.
| Approach | What it showed | What it could not show |
|---|---|---|
| Pattern seeking | Urban streams in Auckland score lowest | The health of this stream |
| Classifying and identifying | This stream: MCI 86, 22% EPT kinds | Why the score is low |
| Fair testing | More nutrients, more algae in jars | Nutrient levels in the stream itself |
The maths behind it
How is NCEA Level 1 maths going?
See the NCEA Level 1 maths guide