Biology investigation: catalase and temperature, start to finish
What this lesson covers
- What Achieved, Merit and Excellence each need in a Level 2 biology investigation.
- Writing the purpose as a hypothesis that is linked to a biological idea.
- Independent, dependent and controlled variables, a valid range, repeats and sample size.
- Fair tests and pattern seeking, and how to avoid sampling bias in a field study.
- Processing raw results into means and rates, graphing them and reaching a conclusion from the trend.
- Discussing reliability, validity, sources of error and the biology that explains the result.
What the standard rewards
- AS 91153 is a 4-credit internal. You plan and carry out your own investigation, collect your own data, process it and write a report, usually over a few lessons with your teacher supervising.
- Your teacher sets the context and the equipment, and can talk through your ideas while you plan. The planning, the data and the writing must be yours, even if you collect data in a group.
- Each grade builds on the one below it. Merit is about a sound method and a clear trend; Excellence is about justifying your choices and explaining your result with biology.
| Grade | What your report needs |
|---|---|
| Achieved | A hypothesis linked to biology; a method with a range for the independent variable, how the dependent variable is measured and some controlled variables; recorded and processed data; a conclusion from your data; a finding from another source |
| Merit | A valid range and a valid way of measuring; the other key variables controlled; sources of error and bias considered; processed data that shows a trend (or shows there is none); a discussion of the biology using your results and another source |
| Excellence | Everything for Merit, plus reasons for your choices, an evaluation of how valid your method was and how reliable your data is, and a conclusion explained with the biological ideas behind it |
The purpose, written as a hypothesis
- A Year 12 class was given potatoes, 3% hydrogen peroxide, filter paper discs and water baths, and asked to investigate an enzyme. They chose catalase, which breaks hydrogen peroxide down into water and oxygen: 2H₂O₂ → 2H₂O + O₂.
- Their purpose: to find out how temperature affects the rate at which potato catalase breaks down hydrogen peroxide.
- A hypothesis turns the purpose into a prediction with a reason. Theirs: as temperature rises from 10 °C to about 40 °C the rate will increase, because molecules move faster and collide with the active site more often; above about 40 °C the rate will fall, because heat changes the shape of the active site and the enzyme denatures.
- The reason is what links it to a biological idea. A prediction with no 'because' is not yet a hypothesis for this standard.
Variables and the method
- Independent variable: temperature, at 10, 20, 30, 40, 50 and 60 °C. Six values 10 °C apart cover both sides of the expected peak, which makes the range valid.
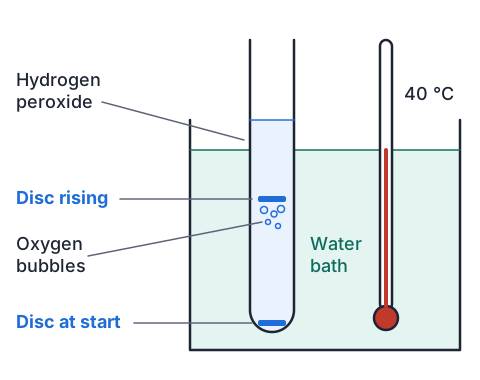
- Dependent variable: the time in seconds for a disc soaked in potato extract to rise from the bottom of 10 mL of hydrogen peroxide to the surface. Oxygen bubbles from the reaction lift the disc, so a faster reaction means a shorter time.
- Controlled variables: the same hydrogen peroxide concentration and volume, the same hole punch for every disc, the same extract and soaking time (5 seconds), and 5 minutes in the water bath before each disc goes in so the liquid reaches the set temperature.
- Repeats: three discs at each temperature, so an odd result shows up and the mean is more reliable.
- Safety: hydrogen peroxide irritates eyes and skin, so wear safety glasses and wipe up spills straight away.
When you cannot change the variable: pattern seeking
- Some investigations look for a pattern instead of changing one variable, such as whether leaves are larger in the shade than in the sun on the same kind of shrub.
- Here the method says what data you will collect, from how many samples, and how you will choose them.
- Sampling bias creeps in when you pick the leaves that look interesting. Choosing them at random (for example, every fifth leaf along a branch, at the same height on each plant) removes your own choice from the data.
- Sample size matters more in pattern seeking than in a fair test, because living things vary. Thirty leaves from each habitat show a pattern far more clearly than five.
- Factors you cannot control, such as the age of each plant, are recorded and kept as similar as you can, then discussed as possible sources of error.
Example: processing the class's results
- The class's times are in the table. At 30 °C one disc took 26 s; their notes say it stuck to the side of the tube on the way up.
- Time is not a rate. A shorter time means a faster reaction, so they turned each mean time into a rate: rate = 1 ÷ mean time, in s⁻¹.
- Work out the mean and the rate at each temperature, and decide what to do with the 26 s disc.
| Temperature (°C) | Disc 1 (s) | Disc 2 (s) | Disc 3 (s) | Mean time (s) | Rate (s⁻¹) |
|---|---|---|---|---|---|
| 10 | 28 | 31 | 30 | 29.7 | 0.034 |
| 20 | 18 | 17 | 19 | 18.0 | 0.056 |
| 30 | 11 | 12 | 26 (left out) | 11.5 | 0.087 |
| 40 | 8 | 9 | 8 | 8.3 | 0.120 |
| 50 | 14 | 15 | 13 | 14.0 | 0.071 |
| 60 | 41 | 38 | 44 | 41.0 | 0.024 |
- 10 °C: (28 + 31 + 30) ÷ 3 = 29.7 sadd the repeats, divide by how many
- rate = 1 ÷ 29.7 s = 0.034 s⁻¹faster reactions give bigger rates
- 30 °C: (11 + 12) ÷ 2 = 11.5 s, rate = 1 ÷ 11.5 = 0.087 s⁻¹26 s left out: the disc stuck, so it did not measure the reaction
- with the stuck disc: (11 + 12 + 26) ÷ 3 = 16.3 sone faulty disc would make 30 °C look slower than 20 °C
- 40 °C: (8 + 9 + 8) ÷ 3 = 8.3 s, rate = 1 ÷ 8.3 = 0.120 s⁻¹the fastest rate
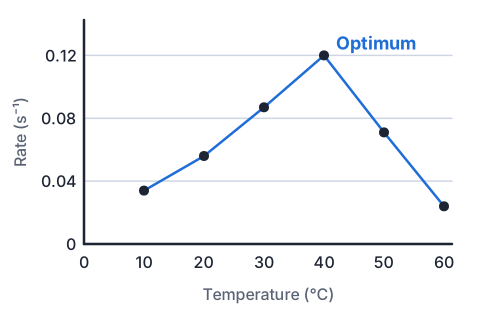
- rate rises from 0.034 s⁻¹ at 10 °C to 0.120 s⁻¹ at 40 °C, then falls to 0.024 s⁻¹ at 60 °C
Example: the graph and the conclusion
- Temperature goes on the x-axis because it is the independent variable; rate goes on the y-axis. Plot the means, not every repeat.
- The trend: the rate more than trebled from 10 °C to 40 °C (0.034 to 0.120 s⁻¹), then fell to 0.024 s⁻¹ at 60 °C, lower than at 10 °C.
- The conclusion answers the purpose from the processed data: in this investigation potato catalase worked fastest at about 40 °C, and the rate fell sharply above that, which supports the hypothesis.
- Say 'about 40 °C': with 10 °C steps the true peak could be anywhere between 30 °C and 50 °C. Extra temperatures at 35 °C and 45 °C would pin it down.
Reliability, validity and sources of error
- Reliability is about the data: would you get the same results again? Close repeats (8, 9 and 8 s at 40 °C) and similar results from another group show the data is reliable.
- Validity is about the method: did it measure what the purpose asked, with only temperature changing? Controlling the peroxide, disc size, extract and time in the bath is what makes it valid.
- Sources of error: the peroxide cools towards room temperature once the tube is lifted out; stopwatch reaction time matters more for short times (8 s) than long ones (41 s); potato extract settles, so later discs may carry more enzyme unless the extract is stirred.
- For each error, say which way it pushes the result and how you reduced it: tubes stayed in the bath during timing, the extract was stirred before each disc, and one person timed every disc.
Discussing the biology behind the trend
- Catalase is a protein enzyme found in most living cells, where it breaks down hydrogen peroxide, a harmful by-product of metabolism, before it damages the cell.
- Below the optimum, warmer means more kinetic energy, so hydrogen peroxide molecules and enzymes collide more often and with more energy, and more enzyme-substrate complexes form each second.
- Above the optimum, the extra energy breaks the weak bonds that hold the enzyme folded. The active site changes shape, the substrate no longer fits, and the enzyme is denatured; cooling it again does not repair it.
- Bring in another source: a second class with the same method also found its fastest rate at 40 °C, which supports the conclusion, and textbooks describe enzymes from warm-blooded animals working best near body temperature, so the peak for a potato enzyme need not be the same as ours.
Example: one paragraph at three grades
- The three paragraphs below are about the same result. Notice what each grade adds.
- Achieved reports the trend. Merit explains it with biology and the other source. Excellence also judges how far the data can be trusted and why the method choices were made.
| Grade | What the student wrote |
|---|---|
| Achieved | The rate increased from 0.034 s⁻¹ at 10 °C to 0.120 s⁻¹ at 40 °C and then decreased to 0.024 s⁻¹ at 60 °C. This supports my hypothesis. |
| Merit | The rate rose to 0.120 s⁻¹ at 40 °C because faster molecules collided with active sites more often. Above 40 °C the rate fell because heat broke bonds in the catalase, changing the active site so it was denatured. Another class also peaked at 40 °C. |
| Excellence | The peak at about 40 °C is supported by close repeats (8, 9 and 8 s) and by another class's matching peak, so the data is reliable. I left out the 26 s disc because it stuck, and keeping tubes in the bath while timing kept the temperature valid. With 10 °C steps the optimum lies between 30 °C and 50 °C; testing 35 °C and 45 °C would narrow it. The rise is explained by more frequent collisions forming enzyme-substrate complexes, and the steep fall by denaturing, which is permanent, so the 60 °C rate was even lower than at 10 °C. |
Common mistakes
- My hypothesis is that temperature will affect catalase.A hypothesis predicts the direction of the change and gives a biological reason for it, such as collisions and denaturing.
- I graphed the time taken, so the graph shows the rate.Time goes down as the reaction speeds up; convert to a rate (1 ÷ time) so the graph rises when the enzyme works faster.
- The high temperatures killed the enzyme.Enzymes are not alive; heat denatures them by changing the shape of the active site so the substrate no longer fits.
- My repeats were close, so my method was valid.Close repeats show reliability; validity comes from measuring the right thing and controlling every other variable.
Feed yeast different amounts of sugar
You need: 3 empty plastic drink bottles the same size, dried baking yeast, sugar, warm tap water, 3 balloons, a piece of string and a ruler, a measuring jug, a teaspoon
- Pour 200 mL of warm tap water into each bottle and label them 0, 1 and 2.
- Add 1 level teaspoon of yeast to every bottle, then 0, 1 and 2 level teaspoons of sugar to match the labels, and swirl each one until mixed.
- Stretch a balloon over the neck of each bottle and stand all three together in the same warm spot.
- After 25 minutes, wrap the string around the widest part of each balloon and measure the length against the ruler.
- Look for: more sugar gives a bigger balloon, because yeast uses sugar in respiration and releases carbon dioxide. The 0 bottle is your control, and the water, yeast, bottles and time are your controlled variables.
Safety: Use plastic bottles, not glass, keep balloons and any burst pieces away from young children, who can choke on them, and do not drink the mixtures.
Your turn
A student investigates how sugar concentration (0, 2, 4, 6 and 8%) affects how fast yeast respires, by counting carbon dioxide bubbles per minute. Name the independent and dependent variables.
Three catalase discs rise in 20 s, 22 s and 21 s. Find the mean time and the rate.
Write a hypothesis for the yeast investigation in question 1, with a biological reason.
At one temperature the discs take 20 s, 22 s and 45 s, and the student noted the third disc stuck to the tube. What should the mean be, and why?
A group's three repeats at every temperature were within 2 s of each other. Is that evidence of reliability or of validity?
In a field study comparing leaf size in sun and shade, why should leaves be picked at random?
Show answer
1. Independent: sugar concentration; dependent: bubbles of carbon dioxide per minute. 2. Mean = (20 + 22 + 21) ÷ 3 = 21 s; rate = 1 ÷ 21 = 0.048 s⁻¹. 3. For example: as sugar concentration increases from 0% to 8%, the number of bubbles per minute will increase, because glucose is the substrate for respiration, so more is available to the yeast's enzymes each second. 4. (20 + 22) ÷ 2 = 21 s, leaving out the 45 s disc and recording why: it stuck, so its time did not measure the reaction. 5. Reliability: close repeats show the data can be repeated; they do not show the method measured the right thing. 6. To avoid sampling bias: if you choose the leaves yourself you may pick big or unusual ones, so the sample would not represent the plants.
Recap
- Write the purpose as a hypothesis with a 'because' that names a biological idea.
- Choose a range that covers the whole trend, measure one dependent variable well, control the rest, and repeat.
- Process raw data into means and rates, leave out an odd result only with a recorded reason, and graph the means.
- Merit discusses the biology using your data and another source; Excellence also justifies your choices and evaluates validity and reliability.
| Word | What it means here |
|---|---|
| Reliable | Repeats and other groups give similar results |
| Valid | The method measures the purpose, with only one variable changed |
| Sampling bias | Your choice, not chance, decides which samples are measured |
| Denatured | Heat has changed the active site, so the enzyme no longer works |
The maths behind it
How is NCEA Level 2 maths going?
See the NCEA Level 2 maths guide