Carrying out an Earth and Space Science investigation
What this lesson covers
- What the report needs: a purpose, a method, raw data, processing, a conclusion and the science behind the results.
- Writing an investigable purpose with one independent and one dependent variable.
- Choosing a range for the independent variable, measuring the dependent variable well, and controlling the others.
- Repeats, means, odd results, and the difference between reliable and valid data.
- Graphing processed data and reading the trend.
- Linking results to the science (energy, craters, why the Moon keeps its craters) for Merit and Excellence.
What the investigation must include
- AS 91187 is an internal: you plan and carry out your own practical investigation, then write a report on it.
- The report needs a purpose that comes from an Earth and Space Science context, and a method that gives the values you will use for the independent variable, how you will measure the dependent variable, how you will keep other variables steady and how you will record the raw data.
- Then come your raw results, the processed data (means, a graph), a conclusion that answers the purpose, and the Earth and Space Science that explains what happened.
- Merit asks for more: a method you have trialled and then confirmed or improved so the data are valid and reliable, a conclusion the data really support, and an explanation of the science, not just a description.
- Excellence adds two things: explaining how your method made the data reliable, and explaining the science in detail by tying each result, its interpretation and the conclusion back to it.
- Your teacher can give background and a broad topic, but the purpose, the method and the investigation itself are yours; there is no template to fill in.
An investigable purpose
- An investigable purpose names one thing you change (the independent variable) and one thing you measure (the dependent variable), in a context from Earth or space.
- Our class's context: the Moon is covered in craters of very different widths, made by rocks hitting it at different speeds. Their purpose: to find out how the drop height of a marble affects the diameter of the crater it makes in flour.
- A hypothesis gives a prediction and a reason: a higher drop gives the marble more energy when it lands, so it should push more flour aside and make a wider crater.
- Other purposes that work well: how particle size affects how fast sediment settles in water, how slope angle affects the mass of sand washed down a model hillside, or how salt content affects whether coloured water floats or sinks in a tank.
- Avoid purposes you cannot test with your own measurements, such as how old a crater is, or ones with no clear measured result, such as whether craters look interesting.
The method: ranges, measuring and controlling
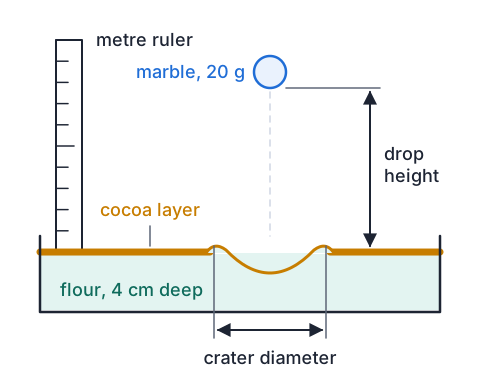
- Independent variable: drop height, at 20, 40, 60, 80 and 100 cm. Five values spread evenly over a wide range are enough to show a trend on a graph.
- Dependent variable: crater diameter in centimetres, measured rim to rim with a ruler in two directions at right angles and averaged, because craters are rarely perfect circles.
- Height is measured from the flour surface to the bottom of the marble, and the marble is released from rest, never thrown.
- The same 20 g marble, the same tray and 4 cm of flour are used every time, and the flour is sifted and scraped level between drops so it is equally loose.
- Three drops at each height are the repeats: they show whether the results agree, and they let you take a mean.
| Variable | Type | How it is handled |
|---|---|---|
| Drop height | Independent | 20 to 100 cm in 20 cm steps |
| Crater diameter | Dependent | Rim to rim, two directions, averaged |
| Marble | Controlled | Same 20 g marble each time |
| Flour depth and looseness | Controlled | 4 cm, sifted and levelled before each drop |
| Release | Controlled | From rest, height to bottom of marble |
Trial, then confirm or improve the method
- The class did a quick trial run before collecting real data, which is what Merit and Excellence reports describe.
- Problem 1: the crater rim was hard to see in white flour. Fix: a thin dusting of cocoa on top, so the flour thrown out of the crater shows up pale against brown.
- Problem 2: drops from 100 cm sometimes hit the edge of an earlier crater. Fix: smooth the whole tray after every drop, not just the crater.
- Problem 3: two students measured the same crater 0.4 cm apart. Fix: one person measures every crater, always rim to rim at the highest point of the rim.
- Each fix makes the data more valid (it measures what the purpose asks, fairly) or more reliable (repeats give closely matching values).
Example: processing the crater results
- The class's raw data are in the table. One drop at 60 cm gave 8.9 cm, far from its repeats of 6.5 and 6.7 cm.
- Their notes said that marble clipped the side of the ruler and bounced, so it broke the method; they left it out of the mean and wrote down why.
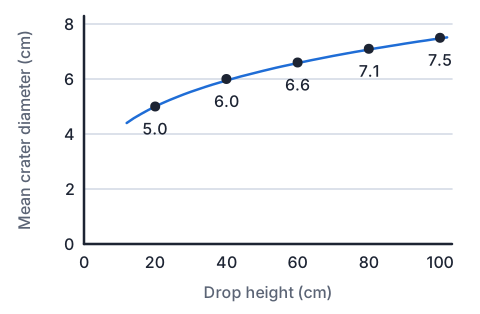
- Find each mean, then describe the trend from the graph.
| Drop height (cm) | Drop 1 (cm) | Drop 2 (cm) | Drop 3 (cm) | Mean (cm) |
|---|---|---|---|---|
| 20 | 4.9 | 5.1 | 5.0 | 5.0 |
| 40 | 6.0 | 5.9 | 6.1 | 6.0 |
| 60 | 6.5 | 6.7 | 8.9 (left out) | 6.6 |
| 80 | 7.0 | 7.2 | 7.1 | 7.1 |
| 100 | 7.4 | 7.6 | 7.5 | 7.5 |
- 20 cm: (4.9 + 5.1 + 5.0) ÷ 3 = 5.0 cmadd the repeats, divide by how many
- 40 cm: (6.0 + 5.9 + 6.1) ÷ 3 = 6.0 cmgive means to 0.1 cm, like the raw data
- 60 cm: (6.5 + 6.7) ÷ 2 = 6.6 cmthe 8.9 cm bounce is left out, with the reason recorded
- 60 cm with the bounce: (6.5 + 6.7 + 8.9) ÷ 3 = 7.4 cmbigger than the 80 cm mean, which makes no sense
- rises of 1.0, 0.6, 0.5 and 0.4 cm for each extra 20 cmthe gaps between the means
- higher drops give wider craters, but each extra 20 cm adds less width
Graphing processed data
- Put the independent variable (drop height) on the x-axis and the dependent variable (mean diameter) on the y-axis, each with a label and unit.
- Choose even scales that use most of the grid, and plot the means, not every raw value.
- When the points curve, draw a smooth curve of best fit rather than joining the dots or forcing a straight line.
- Do not drag the line to (0, 0): a marble set down gently still leaves a dent about as wide as itself, so a 0 cm drop does not mean a 0 cm crater.
- Describe the shape in words with numbers: from 20 to 40 cm the diameter rose 1.0 cm, but from 80 to 100 cm only 0.4 cm, so the curve levels off.
The science that explains the craters
- A raised marble has gravitational potential energy, Ep = mgh. As it falls this becomes kinetic energy, so a higher drop means a faster marble with more energy at impact.
- On impact that energy pushes flour down and outwards, throws some up and out as a rim and a spray of ejecta, and the rest becomes heat and sound.
- The width grows more slowly than the energy because the crater is a bowl: its volume grows roughly with the cube of its width, so a much bigger energy is needed for a slightly wider bowl.
- Craters on the Moon form the same way, only with rocks arriving at kilometres per second, so even a small rock can blast out a crater many times its own size.
- The Moon keeps its craters for billions of years because it has no air, running water or moving plates. On Earth, weathering, erosion, sediment and plate tectonics wipe most craters away, which is why Earth looks far less cratered.
- Ep = mghm in kg, g = 9.8 N/kg, h in m
- 20 cm: Ep = 0.020 × 9.8 × 0.20 = 0.039 J
- 100 cm: Ep = 0.020 × 9.8 × 1.00 = 0.196 J
- 0.196 ÷ 0.039 ≈ 5five times the energy
- 7.5 ÷ 5.0 = 1.5only one and a half times the width
- five times the energy made a crater only 1.5 times as wide
Example: the discussion at each grade
- Achieved describes the trend and gives the science in simple terms.
- Merit explains the trend with the science and shows the conclusion is supported by the data, including how the method was checked.
- Excellence explains how the method produced reliable data and ties every part (results, interpretation, conclusion) to the science in detail.
| Grade | What the student wrote |
|---|---|
| Achieved | As the drop height went up from 20 cm to 100 cm, the crater got wider, from 5.0 cm to 7.5 cm. This is because the marble had more energy when it was dropped from higher. |
| Merit | Diameter rose from 5.0 cm to 7.5 cm as height rose from 20 to 100 cm. A higher drop gives more gravitational potential energy, which becomes kinetic energy, so the marble moves more flour on impact. After a trial run we added cocoa to see the rim and levelled the whole tray each time, so the diameters were measured fairly and the conclusion is valid. |
| Excellence | Our repeats agreed within 0.2 cm at every height, because one person measured every crater in two directions at the highest point of the rim and the flour was re-sifted before each drop; the one bounce was spotted and explained. Energy rose five times (0.039 J to 0.196 J) but width only 1.5 times, which fits the science: the energy has to move a bowl of flour whose volume grows about with the cube of its width, so the curve levels off. Moon craters form the same way, which is why bigger impacts give wider craters but not in proportion. |
Common mistakes
- My results are reliable because I was careful.Reliable means repeats closely agree; quote the spread, such as all repeats within 0.2 cm, and say what in the method made that happen.
- I put every result in the mean, even the one that bounced.If a result breaks the method and you can say how, leave it out of the mean and record the reason, or redo that drop.
- I joined my points dot to dot and drew the line through zero.Draw a smooth curve or straight line of best fit through the means, and only through (0, 0) if the science says it must pass there.
- My science section explains what a crater is.The science must explain your results: why your trend has the shape it has, using ideas such as Ep = mgh and energy spreading into the flour.
Investigate how sediment settles in water
You need: a tall clear jar or bottle with a tight lid, water, a cup of garden soil with small stones in it, a ruler, a phone timer, a pen and paper
- Fill the jar about one third full of garden soil, then fill it almost to the top with tap water and screw the lid on tightly.
- Shake it hard for 30 seconds, stand it on a flat table and start the timer.
- At 1 minute, 10 minutes, 1 hour and the next morning, measure the depth of each layer that has settled on the bottom, in millimetres.
- Write your results in a table and describe how the layers changed with time.
- Look for: the stones and coarse sand settle in seconds, silt over minutes, and the finest clay can keep the water cloudy overnight. Heavy grains sink first, which is why a flooding river drops gravel first and carries mud out to sea.
Safety: Garden soil can carry tetanus and other bacteria, so keep the lid on tight while shaking, do not use potting mix (it can carry Legionella), and wash your hands well afterwards.
Your turn
Three repeats give crater diameters of 8.2 cm, 8.6 cm and 8.4 cm. Find the mean.
Purpose: to find out how the slope angle of a sand tray affects the mass of sand washed off by 500 mL of water. Name the independent and the dependent variable.
Repeats at 80 cm are 7.0 cm, 7.2 cm and 9.6 cm, and the third marble hit an old crater. Find the mean you should report.
A 20 g marble is dropped from 0.50 m. Calculate its gravitational potential energy (g = 9.8 N/kg).
Which change to a method makes the data more reliable?
Explain why the crater widths rise by less with each extra 20 cm of drop height.
Show answer
1. (8.2 + 8.6 + 8.4) ÷ 3 = 8.4 cm. 2. Independent: the slope angle; dependent: the mass of sand washed off. 3. Leave out 9.6 cm and record why: (7.0 + 7.2) ÷ 2 = 7.1 cm. 4. Ep = mgh = 0.020 × 9.8 × 0.50 = 0.098 J. 5. Doing three or more repeats at each value and checking they agree closely, with one person measuring the same way each time. 6. The energy rises in proportion to the height, but it has to move a bowl of flour whose volume grows much faster than its width, so each extra bit of energy widens the crater less.
Recap
- A purpose names one independent and one dependent variable in an Earth or space context.
- The method sets a wide, even range, says how the result is measured and keeps the other variables steady, with repeats.
- Process into means, leave out an odd result only with a recorded reason, and graph means with a line or curve of best fit.
- Merit trials and improves the method and explains the science; Excellence explains why the data are reliable and links every result to the science.
| Grade | What it adds |
|---|---|
| Achieved | Purpose, method, raw and processed data, conclusion, the science described |
| Merit | Method trialled and confirmed or improved, valid conclusion, the science explained |
| Excellence | How the method gave reliable data, the science linked in detail to every result |
The maths behind it
How is NCEA Level 2 maths going?
See the NCEA Level 2 maths guide