Sea-level rise in Aotearoa: an issue and its sources
What this lesson covers
- What the report needs: processed information on an issue, comments on the validity of key sources, and a conclusion or position.
- Choosing an Earth and Space Science issue with science on both sides.
- The science of sea-level rise: warming water, melting land ice and land that rises or sinks.
- Processing real tide-gauge data from four New Zealand ports.
- Judging validity: who produced it, the evidence and method, how current it is, purpose and bias, and whether other sources agree.
- Writing a position for Merit and a justified position for Excellence.
What the report must include
- AS 91188 is an internal: you research and write up an Earth and Space Science issue, a question people disagree about, where science supports more than one side.
- You find and process information (pick out what matters, turn data into rates, totals or a graph, and put it in your own words), then report on the issue.
- You comment on how valid at least two scientific sources are, the kind the public actually sees: government pages, research programme sites, news stories, documentaries.
- Then you reach a conclusion on the issue, backed by the science you found.
- Merit needs wider coverage of the issue, a comparison of the sources' validity with reasons from the science, and a clear position. Excellence needs full coverage, an evaluation of validity, and a position you justify using the processed information, your conclusion and how far the sources can be trusted.
- List every source so a marker can find it again: author or organisation, date, title, web address and the date you accessed it.
Choosing an issue with science on both sides
- A good issue is a should-question that people argue about, with Earth and Space Science evidence for each side.
- Ours: should councils stop new homes being built on low-lying coastal land because of sea-level rise?
- For a ban: sea level around New Zealand is rising faster now than a century ago, and in many places the land itself is sinking, so homes built today could flood within their lifetime.
- Against a ban: the rise is a few millimetres a year, some coasts are being lifted, and projections depend on future emissions and on how fast Antarctic ice melts, so the risk differs a lot from place to place.
- Other issues that work: should Aotearoa allow more rocket launches from Māhia, should towns build on the Alpine Fault, or should streetlights be dimmed to protect dark-sky reserves?
The science of a rising sea
- Seawater expands as it warms, so a warmer ocean takes up more room and its surface rises.
- Melting land ice (mountain glaciers and the Greenland and Antarctic ice sheets) adds water that was stored on land. Melting sea ice adds almost nothing, because floating ice already pushes aside its own weight of water.
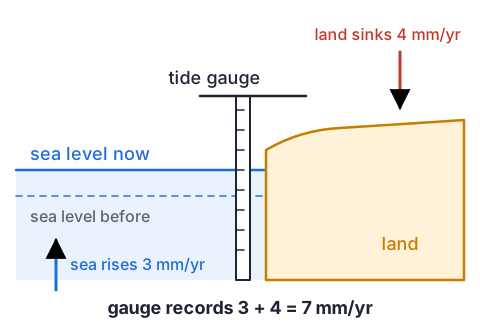
- A tide gauge on a wharf measures relative sea level: the sea compared with the land the gauge stands on.
- If the land under the gauge sinks, the sea seems to rise faster; if the land is pushed up, it seems to rise more slowly.
- Example: the ocean rises 3 mm a year and the land sinks 4 mm a year, so the gauge records 3 + 4 = 7 mm a year of relative rise.
Example: processing 120 years of tide-gauge data
- Stats NZ reports NIWA's analysis of four long tide-gauge records, as average rates of rise relative to the land.
- Process them: compare the two 60-year periods, and turn a rate into a total a reader can picture.
| Port | 1901 to 1960 (mm/yr) | 1961 to 2020 (mm/yr) | 1901 to 2020 (mm/yr) |
|---|---|---|---|
| Auckland | 1.83 | 2.54 | 1.71 |
| Wellington | 1.23 | 2.84 | 2.04 |
| Lyttelton | 1.33 | 2.77 | 2.24 |
| Dunedin | 0.69 | 1.76 | 1.52 |
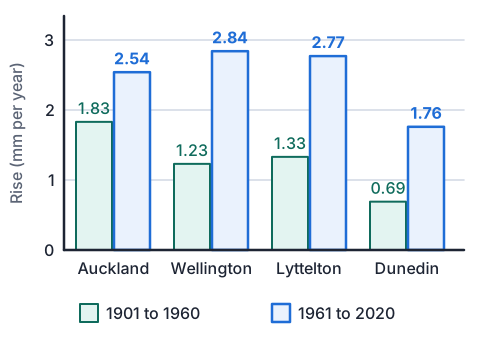
- Wellington: 2.84 ÷ 1.23 = 2.3the recent rate is more than double the early one
- Wellington, 1961 to 2020: 2.84 mm/yr × 60 yr = 170 mm ≈ 17 cmrate × time gives the total rise
- Wellington, 1901 to 2020: 2.04 mm/yr × 120 yr = 245 mm ≈ 24 cm
- all four ports rose faster in 1961 to 2020 than in 1901 to 1960every second bar is taller
- the sea is rising faster than before everywhere measured, by about a quarter of a metre in Wellington since 1901
Land that moves: why the rise differs along the coast
- New Zealand sits on the boundary between the Pacific and Australian plates, so its coast is slowly being pushed up in some places and pulled down in others, even between earthquakes.
- The NZ SeaRise programme combined satellite radar and GPS to measure this every 2 km around the coast.
- About 40% of the coastline is sinking between earthquakes. Some parts are rising by up to 5 mm a year and others sinking by as much as 8 mm a year.
- In parts of Auckland, Hawke's Bay, Wairarapa, Wellington, Nelson and Marlborough the land is sinking by 2 to 6 mm a year, which can double the local rise.
- This is science on both sides of our issue: sinking coasts strengthen the case for limits there, while rising coasts weaken it, so one national rule may not fit every town.
| Measured land movement | Value |
|---|---|
| Share of coastline sinking between earthquakes | About 40% |
| Fastest uplift measured | Up to 5 mm a year |
| Fastest sinking measured | Up to 8 mm a year |
| Sinking in parts of Auckland, Wellington and four other regions | 2 to 6 mm a year |
How to judge whether a source is valid
- Who made it: an organisation or person with expertise in the science, named and contactable?
- Evidence and method: does it show real measurements, say how they were made, and give their uncertainty? Has it been checked by other scientists?
- How current: is it the latest data, or has newer work replaced it?
- Purpose and bias: is it trying to inform, persuade, sell or entertain, and who paid for it?
- Agreement: do other independent sources say the same thing? A claim backed by several separate lines of evidence is stronger.
Example: comparing three sources the public sees
- Source A is the Stats NZ indicator page. Source B is the NZ SeaRise vertical land movement page. Source C is an imagined social media post: 'I've fished off this wharf for 50 years and the water's no higher. Sea-level rise is a myth.'
- The table judges each one. The best judgements give a science reason, not only who made it.
- Notice that A and B agree with each other although they use different methods (tide gauges and satellites), which makes both more believable.
| Source | Strengths | Weaknesses | Judgement |
|---|---|---|---|
| A: Stats NZ indicator | Government statistics agency using NIWA's analysis of LINZ tide gauges; 120 years of measurements; gives the uncertainty of each rate | Only four long records, so it cannot show how much the rise differs along the rest of the coast; data end in 2020 | Highly valid for the long-term trend at those ports |
| B: NZ SeaRise page | University-led research programme; satellite radar and GPS every 2 km of coast; its results are published in journals | A summary page, so methods and uncertainties are in other papers; written to urge councils to adapt, and its biggest numbers depend on the emissions scenario chosen | Valid for where the land is moving; check the scenario before quoting a projection |
| C: social media post | A real local memory over 50 years | No measurements; at 2 to 3 mm a year, 50 years gives only 10 to 15 cm, far less than the daily rise and fall of the tide, so it cannot be seen by eye | Not valid as evidence; it does not disprove the tide-gauge records |
Example: the conclusion and position at each grade
- Achieved draws a conclusion from the information and says something about the sources.
- Merit states a position, links it to the processed information, and compares the sources with science reasons.
- Excellence justifies the position: it weighs evidence from both sides with numbers, and says how the validity of each source affects how much weight it gets.
| Grade | What the student wrote |
|---|---|
| Achieved | Sea level is rising around New Zealand, and faster than it used to. Stats NZ is a good source because it is the government. I think councils should stop building on low coastal land. |
| Merit | Councils should limit new homes on low coastal land. All four tide gauges rose faster after 1960, Wellington from 1.23 to 2.84 mm a year, and NZ SeaRise found parts of six regions sinking 2 to 6 mm a year, which adds to the rise. The tide-gauge data are more valid than the fishing post, because they are measured to fractions of a millimetre while the post relies on memory. |
| Excellence | Councils should limit new homes on low coastal land where the land is sinking, but not everywhere. The tide gauges are the most valid evidence, 120 years of measurements with stated uncertainty, and they show the rise more than doubling in Wellington. Satellite data from NZ SeaRise agree and add that sinking of 2 to 6 mm a year can double the rise locally, though some coasts rise up to 5 mm a year. Because a house lasts 50 to 100 years, even 3 to 7 mm a year adds 15 to 70 cm over its life, so a rule matched to each place's land movement is justified. The post is rejected: a 10 to 15 cm change is hidden by the tide. |
Common mistakes
- Stats NZ is valid because it is a government website.Say why the information is valid: long-term measured data, a stated method and uncertainty, and agreement with other sources.
- Melting sea ice is a main cause of sea-level rise.Floating sea ice already displaces its own weight of water; the rise comes from warming water expanding and from ice melting on land.
- I only included evidence for my side so my position looks stronger.Report the science on both sides, then explain why the evidence for your position outweighs the rest.
- The sea is rising the same amount everywhere in New Zealand.Tide gauges measure the sea against the land, and the land is sinking in some places and rising in others.
Does melting ice raise the water level?
You need: two identical clear glasses or jars, water, 6 ice cubes, a small plastic lid or bottle cap that stands up in a glass, a marker pen or tape, a ruler
- Stand the lid or cap upright in glass B as a small island. Half fill both glasses with tap water to the same height.
- Float 3 ice cubes in glass A (sea ice). Stack 3 ice cubes on the island in glass B so none touch the water (land ice).
- Mark the water level on both glasses with the pen or tape, and measure each height with the ruler.
- Leave them for an hour until the ice has melted, then mark and measure the new levels.
- Look for: glass A's level barely changes, because floating ice had already pushed aside its own weight of water, while glass B's level rises as meltwater runs off the island, like ice melting off Antarctica.
Safety: Wipe up any spilled water and melted ice straight away so nobody slips, and use plastic or sturdy glasses that will not break if knocked.
Your turn
Auckland's sea level rose 2.54 mm a year from 1961 to 2020. How much is that over the 60 years, in centimetres?
Dunedin's rate rose from 0.69 to 1.76 mm a year. How many times faster is the later rate, to one decimal place?
The ocean near a town rises 3 mm a year, and the land there is being pushed up by 1 mm a year. What relative rise does the town's tide gauge record?
Which is more valid evidence of the national trend: 120 years of tide-gauge records, or a homeowner's two photos of a beach 30 years apart?
Give one Earth and Space Science point against a nationwide ban on new coastal homes.
What lifts a Merit position to Excellence?
Show answer
1. 2.54 × 60 = 152.4 mm ≈ 15 cm. 2. 1.76 ÷ 0.69 = 2.55, so about 2.6 times faster. 3. 3 − 1 = 2 mm a year, because the rising land cancels part of the rise. 4. The tide-gauge records: measured to fractions of a millimetre over a long time, with a stated method, while photos depend on the tide and season when each was taken. 5. Some coasts are being pushed up by as much as 5 mm a year, which cancels much of the rise there, so the risk differs from town to town. 6. Justifying it: weighing evidence from both sides with numbers, and saying how the validity of each source affects how much weight it gets.
Recap
- Pick an issue with Earth and Space Science on both sides, and process the information into rates, totals and comparisons.
- Relative sea level is the sea against the land: warming water and melting land ice raise the sea, and moving land changes the local rise.
- Judge validity with science reasons: expertise, measured evidence and method, how current it is, purpose and bias, and agreement.
- Excellence justifies a position by weighing both sides and the validity of each source.
| Grade | Information | Validity | Ending |
|---|---|---|---|
| Achieved | Relevant, processed | Comment on two or more sources | A conclusion |
| Merit | Wide coverage | Compare sources, science reasons | A stated position |
| Excellence | Full coverage | Evaluate sources, science reasons | A justified position |
The maths behind it
How is NCEA Level 2 maths going?
See the NCEA Level 2 maths guide