Stars: fusion, the HR diagram and life cycles
What this lesson covers
- Stars form when gravity collapses a cold cloud of gas and dust; the core heats until hydrogen fusion starts, and a brown dwarf never gets hot enough.
- On the main sequence, outward pressure from fusion energy balances gravity; more massive stars are hotter, brighter and burn out faster.
- Colour shows surface temperature, and luminosity is the energy given out each second, set by temperature and surface area.
- The HR diagram plots luminosity against temperature: main sequence, giants and supergiants, and white dwarfs each sit in their own region.
- Stars under about 8 Sun masses end as white dwarfs; heavier stars explode as supernovae and leave a neutron star or a black hole.
- Apparent brightness falls with the square of distance, so a dim-looking star may be very luminous but far away.
How a star is born
- Stars form in cold, dense clouds of gas (mostly hydrogen) and dust called molecular clouds, or stellar nurseries.
- Clumps in the cloud pull in more material by gravity; as a clump collapses, gravitational potential energy becomes kinetic energy of the particles, so it heats up: this is a protostar.
- A protostar shines only from the heat of its collapse; when its core reaches millions of degrees, hydrogen nuclei move fast enough to fuse into helium.
- Fusion releases energy that heats the core and creates outward pressure; when that pressure balances gravity, the collapse stops and a main sequence star is born.
- A clump with too little mass never gets hot enough for steady hydrogen fusion: it becomes a brown dwarf, a failed star that glows dimly in infrared and is not on the HR diagram.
| Star birth | NASA figure |
|---|---|
| Stars that are on the main sequence | around 90% |
| Mass range of main sequence stars | a tenth to 200 times the Sun's mass |
| Mass of a brown dwarf | 13 to 80 times the mass of Jupiter |
The Sun: fusion against gravity
- In the Sun's core, hydrogen nuclei fuse into helium; the helium has slightly less mass than the hydrogen that made it, and that missing mass becomes energy (E = mc²).
- The Sun turns about 4.26 billion kg of mass into energy every second, and gives out 3.828 × 10²⁶ joules of energy each second.
- Gravity pulls the Sun's gas inward; the pressure from the hot core pushes outward, and the two balance, so the Sun stays the same size for billions of years.
- A more massive star has stronger gravity squeezing its core, so the core is hotter, fusion is much faster, and the star is hotter, bluer and far more luminous, but it uses its fuel up sooner.
- Red dwarfs, the smallest main sequence stars, fuse so slowly that they will shine far longer than the Sun.
| The Sun | NASA figure |
|---|---|
| Mass | 1.988 × 10³⁰ kg |
| Radius | 695 700 km |
| Luminosity | 3.828 × 10²⁶ W |
| Surface (effective) temperature | 5772 K |
| Core temperature | 1.571 × 10⁷ K |
| Mass turned into energy | 4.26 × 10⁹ kg every second |
| Spectral type | G2 V (a yellow main sequence star) |
Colour, temperature and luminosity
- A star's colour shows its surface temperature: red stars are the coolest, yellow stars like the Sun are in between, and blue-white stars are the hottest.
- Luminosity is the total energy a star gives out each second, measured in watts or compared with the Sun (Sun = 1).
- Luminosity depends on temperature and on surface area: a hotter surface gives out more energy from each square metre, and a bigger star has more square metres.
- So a cool red star can still be very luminous if it is enormous (a red giant), and a hot white star can be dim if it is tiny (a white dwarf).
- Astronomers sort stars by spectral type from hottest to coolest: O, B, A, F, G, K, M; the Sun is G.
- The Matariki cluster (the Pleiades) is a family of young, hot, blue-white stars; its rising in midwinter marks the Māori New Year, now a public holiday.
| Matariki (Pleiades, M45) | NASA figure |
|---|---|
| Distance | about 445 light-years |
| Stars in the cluster | over a thousand |
The Hertzsprung-Russell (HR) diagram
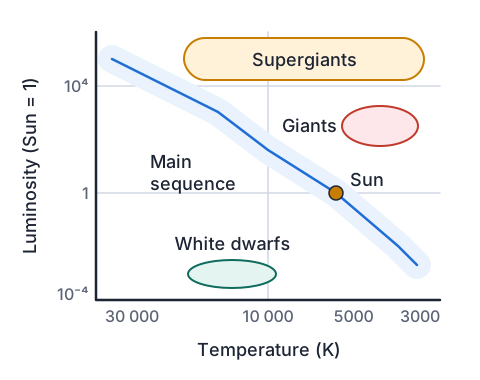
- The HR diagram plots luminosity (up the side) against surface temperature (along the bottom), with temperature increasing to the left.
- Most stars lie on the main sequence, a band from hot, bright, massive stars at the top left to cool, dim, low-mass red dwarfs at the bottom right.
- Giants and supergiants sit at the top right: cool but very luminous, so they must be huge.
- White dwarfs sit at the bottom left: hot but dim, so they must be tiny, about the size of Earth.
- A star does not slide along the main sequence; it stays nearly in one place while it fuses hydrogen, then moves off to the giant region when its core hydrogen runs out.
Example: reading sizes off the HR diagram
- Star X has the same surface temperature as the Sun but 100 times its luminosity. Star Y is a white dwarf, much hotter than the Sun but only a thousandth as luminous.
- Explain where each sits on the HR diagram and what that tells you about its size.
- X: same temperature as the Sun, so the same energy from each square metretemperature sets energy per area
- 100 times the energy, so 100 times the surface arealuminosity = energy per area × area
- area ∝ radius², so radius = √100 = 10 times the Sun'ssurface area of a sphere = 4πr²
- X sits above the Sun on the diagram: a giant about 10 times wider
- Y: hotter, so more energy per square metre, yet far less in total, so its surface area must be tinybottom left of the diagram
- Y is a small, dense white dwarf, about the size of Earth
Life cycles depend on mass
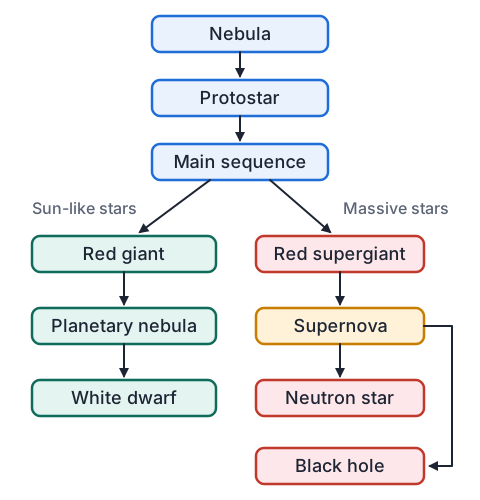
- When the core of a Sun-like star runs out of hydrogen, fusion there slows, gravity squeezes the core and heats it, and hydrogen fuses in a shell around it, so the outer layers swell and cool: a red giant.
- The hotter core then fuses helium into carbon; later the star's outer layers drift away as a glowing planetary nebula, leaving the hot core as a white dwarf that slowly cools.
- A star over about 8 times the Sun's mass has gravity strong enough to keep squeezing its core hotter, fusing heavier and heavier elements in layers: carbon, neon, oxygen, silicon and finally iron.
- Fusing iron takes in energy rather than releasing it, so the core loses its support and collapses almost instantly, then rebounds and blasts the outer layers away in a supernova.
- The leftover core becomes a neutron star, made almost entirely of neutrons; if the leftover core is too massive, not even that can resist gravity, and it collapses into a black hole, from which not even light escapes.
- Supernovae scatter the heavy elements made in stars into space, where they become part of new stars and planets.
| Starting mass | End of life (NASA) |
|---|---|
| under about 8 Sun masses | red giant, planetary nebula, white dwarf |
| about 8 to 20 Sun masses | red supergiant, supernova, neutron star |
| about 20 Sun masses or more | red supergiant, supernova, black hole |
Example: from blue giant to supernova
- A main sequence star has 15 times the Sun's mass. Describe its life from the main sequence to the end, with the energy changes and the role of gravity at each step.
- main sequence: top left of the HR diagram, hot, blue-white and very luminousstrong gravity makes a hot core and fast fusion
- core hydrogen gone: gravity squeezes the core, GPE becomes heat, helium fusion startsthe outer layers swell and cool
- red supergiant: top right of the HR diagram, cool surface but huge arealuminous because it is enormous
- core fuses C, Ne, O, Si in turn, each stage hotter and shorter, ending in ironeach heavier fuel needs a hotter core
- iron cannot release energy by fusion, so gravity wins: the core collapses and reboundsGPE becomes kinetic and heat energy
- supernova, leaving a neutron star (8 to 20 Sun masses at the start)
Brightness and distance
- Apparent brightness is how bright a star looks from Earth; it depends on both its luminosity and its distance.
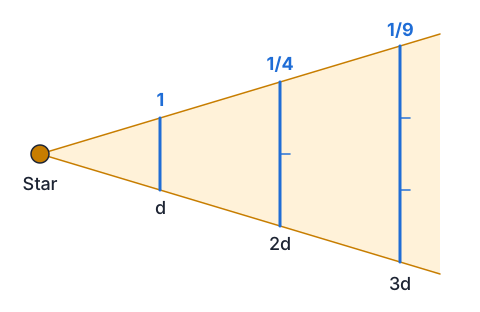
- Light spreads out over a sphere of area 4πd², so doubling the distance spreads it over 4 times the area: the brightness falls to a quarter (the inverse square law).
- A light-year is the distance light travels in a year, about 9.5 trillion km; the nearest star after the Sun, Proxima Centauri, is 4.24 light-years away.
- Gamma Crucis, the red star at the top of the Southern Cross, is a red giant: cool, but bright to our eyes because it is so large.
| Object | Distance (NASA) |
|---|---|
| Proxima Centauri (red dwarf) | 4.24 light-years |
| Alpha Centauri A and B (Sun-like) | 4.37 light-years |
| One light-year | about 9.5 trillion km |
Example: the Sun's brightness at Earth and Mars
- The Sun's luminosity is 3.828 × 10²⁶ W. Earth is 1.496 × 10¹¹ m from the Sun, and Mars is 2.280 × 10¹¹ m.
- Find the energy per second reaching each square metre at Earth, then at Mars.
| Planet | Distance from the Sun (NASA) |
|---|---|
| Earth | 149.6 million km |
| Mars | 228.0 million km |
- brightness = L ÷ (4πd²)energy spread over a sphere of radius d
- Earth: 4π × (1.496 × 10¹¹)² = 2.812 × 10²³ m²
- 3.828 × 10²⁶ ÷ 2.812 × 10²³ = 1361 W/m²
- Mars: (149.6 ÷ 228.0)² = 0.431the inverse square law, as a ratio
- 1361 × 0.431 = 586 W/m²
- Mars is 1.5 times further away, so it gets less than half the sunlight
What Achieved, Merit and Excellence look like
- Achieved names and describes: the stage, the colour, the position on the HR diagram, the fusion.
- Merit explains with a cause: mass, gravity, temperature or fuel use.
- Excellence links mass, gravity, fusion rate, energy and position on the diagram into one argument.
| Grade | A model answer |
|---|---|
| Achieved | The blue star is hotter and bigger, so it gives out more light. |
| Merit | The blue star is more massive, so gravity squeezes its core harder, making it hotter; hydrogen fuses to helium much faster, so it gives out more energy each second. |
| Excellence | Its greater mass gives stronger gravity, a hotter core and much faster fusion, so its surface is hotter (blue) and it is larger. More energy from each square metre over a bigger surface makes it far more luminous, at the top left of the main sequence; the red dwarf is at the bottom right. The blue star also uses up its fuel far sooner than the red dwarf. |
Common mistakes
- A red star is cool, so it must be dim and low on the HR diagram.Colour gives temperature only; a red giant is cool but huge, so it is very luminous and sits at the top right.
- Massive stars live longest because they have the most fuel.They burn it far faster because gravity makes their cores hotter, so they live only millions of years.
- The Sun will explode as a supernova.The Sun is under 8 Sun masses, so it will become a red giant, then a planetary nebula and a white dwarf.
- The temperature axis on an HR diagram increases to the right.Temperature increases to the left: hot blue stars on the left, cool red stars on the right.
Measure the inverse square law
You need: a torch or a phone torch, a sheet of squared paper or a ruler and pencil, a cardboard sheet with a 1 cm square hole cut in it, sticky tape, a dark room, a tape measure
- Tape the squared paper to a wall, then hold the card with the hole 10 cm from the torch, so a small square of light passes through the hole.
- Hold the wall 20 cm from the torch (measure from the torch), and outline the square patch of light on the paper; then repeat at 30 cm.
- Measure the side of each patch and work out its area.
- Divide each area by the area at 20 cm to see how the same light spreads out.
- Look for: at twice the distance the patch has four times the area, so each square centimetre gets a quarter of the light, just as starlight dims with distance.
Safety: Never shine the torch into anyone's eyes, and keep a clear path in the dark room so nobody trips.
Your turn
What stops a main sequence star from collapsing under gravity?
Where on the HR diagram are white dwarfs, and why are they dim?
If a star were moved to 3 times its distance from us, what fraction of its brightness would we see?
What does a star of 30 Sun masses become at the end of its life?
How far is 4.24 light-years in km, using 1 light-year = 9.5 × 10¹² km?
Show answer
1. Outward pressure from the energy released by fusion in its core balances gravity. 2. Bottom left: they are hot but tiny, so their small surface gives out little energy. 3. 1 ÷ 3² = 1/9 of its brightness. 4. A black hole, after a supernova. 5. 4.24 × 9.5 × 10¹² = 4.0 × 10¹³ km.
Exam-style question: two stars near the Southern Cross
- Alpha Centauri A is a yellow, Sun-like main sequence star 4.37 light-years away. Gamma Crucis, at the top of the Southern Cross, is a red giant much further away, yet both are easy to see.
Compare the colour, surface temperature and position on the HR diagram of the two stars.
Explain how Gamma Crucis can be cooler than Alpha Centauri A but far more luminous.
Explain how a Sun-like star changes from the main sequence into a red giant, referring to gravity, fuel use and energy.
Explain why a star of 15 Sun masses ends very differently from Alpha Centauri A.
Show answer
1. Alpha Centauri A: yellow, about the Sun's temperature, on the main sequence near the middle; Gamma Crucis: red, cooler, at the top right among the giants (Achieved). 2. Merit: luminosity depends on temperature and surface area, so a cooler star can be more luminous if it is much larger. Excellence: each square metre of Gamma Crucis gives out less energy than Alpha Centauri A, but its surface area is so much larger that its total output is far greater, which puts it at the top right of the HR diagram; it looks bright from Earth despite being further away. 3. Achieved: it runs out of hydrogen in its core and swells into a red giant. Merit: without fusion support, gravity squeezes the core, turning gravitational potential energy into heat; hydrogen fuses in a shell, and the outer layers expand and cool. Excellence: the core heats until helium fuses into carbon; the extra energy pushes the outer layers out, so the star becomes larger, cooler (red) and more luminous, moving up and right on the HR diagram. 4. Achieved: it will end in a supernova instead of a white dwarf. Merit: its strong gravity heats the core enough to fuse elements up to iron, then the core collapses. Excellence: iron fusion absorbs energy, so outward pressure fails and gravity collapses the core; the rebound makes a supernova and leaves a neutron star, whereas Alpha Centauri A, under 8 Sun masses, sheds a planetary nebula and leaves a white dwarf.
Recap
- Gravity collapses gas clouds into protostars; fusion starts when the core is hot enough, and a brown dwarf never gets there.
- Main sequence stars balance gravity against fusion pressure; more mass means hotter, brighter and shorter-lived.
- Luminosity depends on temperature and surface area; colour gives temperature.
- HR diagram: main sequence diagonal, giants and supergiants top right, white dwarfs bottom left, temperature increasing to the left.
- Under about 8 Sun masses: red giant, planetary nebula, white dwarf. Over: supergiant, supernova, neutron star or black hole.
| Region of the HR diagram | Temperature | Luminosity | Size |
|---|---|---|---|
| Top of main sequence | hot | high | large |
| Bottom of main sequence | cool | low | small |
| Giants and supergiants | cool | very high | huge |
| White dwarfs | hot | low | tiny |
The maths behind it
How is NCEA Level 2 maths going?
See the NCEA Level 2 maths guide