Planning and running an independent ESS investigation
What this lesson covers
- What a Level 3 investigation report needs, and what moves it from Achieved to Merit and Excellence.
- Turning a broad Earth and Space Science interest into one testable question with a clear independent and dependent variable.
- Primary data you measure and secondary data from NIWA, GeoNet or NASA, and when each fits.
- A method with a sensible range, careful measurement, controlled variables, repeats and a trial run that refines it.
- Processing raw data into means, spotting outliers, and choosing a graph that tests the science, not just shows a trend.
- Evaluating the investigation: reliability, validity, limitations and how the results fit the wider Earth and Space Science.
What AS 91410 asks of you
- AS 91410 is a 4-credit internal: you choose your own Earth and Space Science question, plan and run the investigation yourself, and write a report.
- Achieved needs a clear purpose, a method that names the range of the independent variable, how you measure the dependent variable, how you control other variables and limit error and bias, then raw data, processed data, a conclusion and the science behind it.
- Merit needs a method you have trialled and then confirmed or improved, a conclusion the data really support, and an in-depth explanation of both the science and why your data are valid and reliable.
- Excellence needs you to justify every key method choice and to evaluate the whole investigation against the relevant Earth and Space Science: what fits, what does not, and why.
- Independent means the question and the method come from you; your teacher can suggest a broad area, but not hand you the plan.
Choosing a question you can actually answer
- Start from something in Earth or space that interests you, then narrow it until there is one thing you change or select (the independent variable) and one thing you measure (the dependent variable).
- Primary data are measurements you make yourself, in the lab or the field; secondary data are measurements someone else made, such as NIWA's CliFlo climate records or GeoNet's earthquake catalogue.
- Most schools expect the core of 91410 to be your own practical data; a secondary dataset you process yourself can work too if your school's conditions allow it, and it is always useful for comparing with your own results.
- Aroha's interest was the seasons. Her purpose: to find how the angle at which light strikes a surface affects how much that surface warms in 10 minutes, as a model of the Sun at different heights in the sky.
- Her hypothesis gave a reason: at a lower angle the same beam is spread over a larger area, so each square centimetre receives less energy and warms less.
| Question idea | Independent variable | Dependent variable | Data |
|---|---|---|---|
| Light angle and surface heating | Angle of the lamp | Temperature rise in 10 min | Primary |
| Grain size and settling speed | Sediment grain size | Time to sink 30 cm | Primary |
| Salinity and water density | Salt per litre | Density | Primary |
| Depth and earthquake magnitude | Depth band | Mean magnitude | Secondary (GeoNet) |
Aroha's method
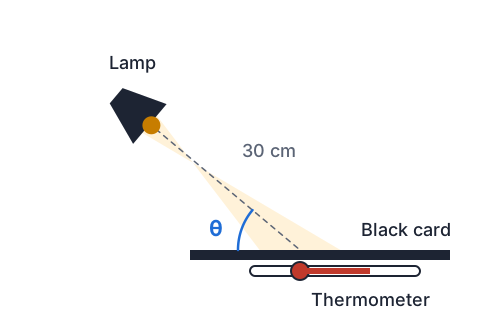
- Independent variable: the angle between the lamp's beam and the card, at 15°, 30°, 45°, 60°, 75° and 90°, set with a protractor. Six values spread over the whole possible range show the shape of the relationship, not just its direction.
- Dependent variable: the rise in temperature of a black card after exactly 10 minutes, read from a thermometer taped under the card so the bulb is not lit directly.
- Controlled variables: the same 60 W incandescent lamp, always 30 cm from the centre of the card measured along the beam with a piece of string, the same card, a room with no draughts, and the card starting at room temperature every run.
- Three runs at each angle, in a random order, so any slow drift in room temperature does not line up with the angle.
The trial run that improved the method
- Aroha did a short trial before collecting her real data, and it changed three things; describing these changes is what Merit reports do.
- Problem: with the thermometer bulb on top of the card, the lamp heated the glass bulb directly, so readings were too high. Fix: tape the bulb underneath, so it measures the card.
- Problem: the distance from lamp to card changed as she tilted the lamp. Fix: a 30 cm string from lamp to card centre, pulled tight for every angle.
- Problem: the card was still warm from one run when the next started. Fix: two identical cards used in turn, each checked to be back at room temperature before a run.
- Each fix improved validity (the readings now measure the warming of the card caused by the angle alone), while the three repeats improved reliability.
Example: from raw data to means
- Aroha's raw temperature rises after 10 minutes are in the table. One reading at 45° stands out.
- Decide what to do with it, then find the mean at each angle.
| Angle | Run 1 | Run 2 | Run 3 | Mean |
|---|---|---|---|---|
| 90° | 8.3 | 8.6 | 8.4 | 8.4 |
| 75° | 8.1 | 7.9 | 8.2 | 8.1 |
| 60° | 7.4 | 7.1 | 7.3 | 7.3 |
| 45° | 5.8 | 6.1 | 9.0 | 6.0 |
| 30° | 4.2 | 4.4 | 4.3 | 4.3 |
| 15° | 2.3 | 2.1 | 2.4 | 2.3 |
- 45°: 9.0 °C is 3 °C above the other two runs, and higher than at 90°that cannot happen if the angle is the cause
- her notes say the card had not cooled fully before run 3a known cause, so the reading is excluded and the reason reported
- mean at 45° = (5.8 + 6.1) ÷ 2 = 5.95, so 6.0 °C
- mean at 90° = (8.3 + 8.6 + 8.4) ÷ 3 = 25.3 ÷ 3 = 8.43, so 8.4 °C
- the spread of the other repeats is 0.3 °C or lesssmall spread means the repeats agree
- means 8.4, 8.1, 7.3, 6.0, 4.3, 2.3 °C from 90° to 15°
Example: a graph that tests the science
- A graph of rise against angle curves, which only tells you the rise gets smaller as the angle falls.
- Her hypothesis predicts something sharper: the energy per square centimetre is proportional to sin θ, so the rise should be proportional to sin θ.
- Plot the mean rise against sin θ. If the hypothesis is right, the points lie on a straight line through the origin.
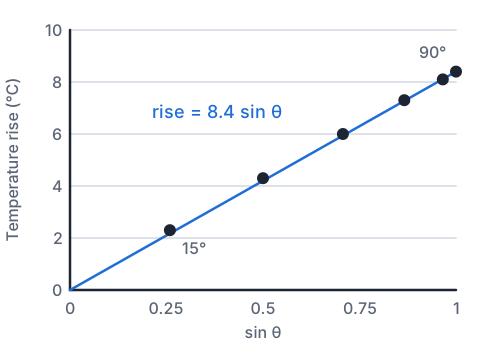
- sin 90° = 1.00, sin 75° = 0.97, sin 60° = 0.87, sin 45° = 0.71, sin 30° = 0.50, sin 15° = 0.26
- gradient of the best line through the origin ≈ 8.4 °Cthe rise for sin θ = 1
- predicted at 30°: 8.4 × 0.50 = 4.2 °C; measured 4.3 °C
- predicted at 15°: 8.4 × 0.26 = 2.2 °C; measured 2.3 °C
- rise ∝ sin θ: the points fit a straight line through the origin
Try it: fit a line to processed data
Linking the results to the Earth and Space Science
- A beam of cross-section A hitting a surface at angle θ spreads over an area A ÷ sin θ, so the energy arriving per square metre is multiplied by sin θ.
- The Sun's height above the horizon at noon plays the same part as Aroha's lamp angle: at an equinox it is 90° minus your latitude, and the 23.4° tilt of Earth's axis adds or takes away up to 23.4° through the year.
- That is why the tropics, with the Sun high all year, receive far more energy per square metre than the poles, and why New Zealand's summer noon Sun heats the ground so much more than its winter one.
- Day length adds to the effect in summer, and a low Sun's light also passes through more atmosphere, so real seasons are stronger than the angle alone predicts.
Example: Wellington's noon Sun in June and December
- Wellington is at latitude 41.3° S.
- Find the Sun's noon elevation at the June and December solstices, and how many times more energy per square metre the December Sun delivers to flat ground.
- December (southern summer): 90° − 41.3° + 23.4° = 72.1°
- June (southern winter): 90° − 41.3° − 23.4° = 25.3°
- ratio = sin 72.1° ÷ sin 25.3° = 0.952 ÷ 0.427 = 2.23
- Aroha's line: 8.4 × 0.952 = 8.0 °C and 8.4 × 0.427 = 3.6 °C; 8.0 ÷ 3.6 = 2.2
- 72.1° and 25.3°; about 2.2 times as much energy per m² in December
Sky and seasons
Evaluating the investigation
- Reliability: the repeats at each angle were within 0.3 °C of each other, and the means sat close to the line, so another run of the method would very likely give the same pattern.
- Validity: the trial fixes meant the thermometer measured the card, not the lamp, at a fixed distance, so the change in rise was caused by the angle.
- Limitations: a lamp's light spreads out from a point while sunlight arrives as parallel rays, so at low angles the far edge of the card was further from the lamp; the thermometer read to 0.1 °C, so the smallest rises have the largest percentage error.
- Against the science: the lab model tests the angle effect only; it leaves out day length and the longer path through the atmosphere, which strengthen real seasons, and Excellence reports say so.
What Achieved, Merit and Excellence look like
- The same result, written up at each grade. Notice that Excellence justifies a choice and evaluates against the science rather than just describing.
| Grade | What the student wrote |
|---|---|
| Achieved | As the angle decreased from 90° to 15°, the temperature rise fell from 8.4 °C to 2.3 °C. This is because at lower angles the light is spread over a bigger area. |
| Merit | The rise was proportional to sin θ: a graph of rise against sin θ is a straight line through the origin with gradient 8.4 °C. The beam spreads over A ÷ sin θ, so each cm² gets less energy. Taping the thermometer under the card, after my trial showed the bulb heating directly, made the readings measure the card itself. |
| Excellence | I chose six angles across the whole range so I could test the sin θ prediction, not just a trend, and randomised the order so room drift could not mimic an angle effect. The data fit rise = 8.4 sin θ to within 0.1 °C, which supports the model of the Sun's elevation controlling energy per m². The model leaves out day length and atmospheric path, so it underestimates the real difference between Wellington's summer and winter. |
Common mistakes
- Doing more repeats makes my data more valid.Repeats improve reliability; validity comes from measuring the right thing and controlling the other variables.
- I left out the 9.0 °C reading because it did not fit my hypothesis.Exclude a reading only with a reason from the method (the card was still warm), and report that you did it.
- My conclusion is that the angle of light causes the seasons.Conclude about what you measured (rise ∝ sin θ), then link it to the seasons as a model, with its limits.
- My evaluation: I could have done it more carefully.Name the specific source of error, its effect on the data, and how you would reduce it.
Measure how a beam spreads with a torch
You need: a small torch that runs on AA or AAA batteries, graph paper, a protractor, a 30 cm ruler, a pencil
- Tape the graph paper flat on a table in a dim room, and hold the torch 20 cm from the paper, measured along the beam, pointing straight down (90°).
- Trace the edge of the bright patch and count the squares inside it.
- Repeat with the torch at 60°, 45° and 30° to the paper, keeping it 20 cm away along the beam each time.
- Divide each area by the area at 90°, and compare it with 1 ÷ sin θ: 1.15 at 60°, 1.41 at 45° and 2.00 at 30°.
- Look for: the same light spreads over a larger patch as the angle falls, so each square receives less, just like low winter sunshine.
Safety: Never shine the torch into anyone's eyes, and do not try this with sunlight, because looking towards the Sun can damage your eyes.
Your turn
Four repeats gave rises of 6.4, 6.6, 9.8 and 6.5 °C, and the notes say the lamp was bumped closer in the third run. Find the mean.
Using Aroha's line, rise = 8.4 sin θ °C, predict the rise at 50°.
What is the Sun's noon elevation at Invercargill (46.4° S) at an equinox?
Auckland is at 36.8° S. Find the noon elevations at the two solstices and how many times more energy per m² the summer Sun delivers.
A student increases the repeats at each angle from 3 to 5. Does this mainly improve reliability or validity?
Show answer
1. The 9.8 °C run has a known cause (the lamp moved closer), so exclude it: (6.4 + 6.6 + 6.5) ÷ 3 = 19.5 ÷ 3 = 6.5 °C. 2. 8.4 × sin 50° = 8.4 × 0.766 = 6.4 °C. 3. 90° − 46.4° = 43.6°. 4. Summer: 90° − 36.8° + 23.4° = 76.6°; winter: 90° − 36.8° − 23.4° = 29.8°; sin 76.6° ÷ sin 29.8° = 0.973 ÷ 0.497 = 1.96 times. 5. Reliability: more repeats give a better mean and show whether results agree, but do not change what is being measured.
Recap
- Your own question: one independent and one dependent variable, from an Earth or space context, with a reason for your prediction.
- Trial the method, then describe how you confirmed or improved it.
- Process repeats into means, exclude outliers only with a reason, and graph in a way that tests the science.
- Merit explains why the data are valid and reliable; Excellence justifies the method and evaluates the whole investigation against the science.
| Word | Means |
|---|---|
| Reliable | Repeats agree; the method gives the same results again |
| Valid | It measures what it claims, with other variables controlled |
| Primary data | Measured by you |
| Secondary data | Measured by someone else, such as NIWA or GeoNet |
The maths behind it
Report a mistake
How is NCEA Level 3 maths going?
See the NCEA Level 3 maths guide