Investigating an Earth and Space Science issue in Aotearoa
What this lesson covers
- What AS 91411 assesses, and how explaining, then evaluating and justifying, lifts the grade.
- Choosing a current New Zealand issue: sea level rise, freshwater allocation or seabed mining.
- The science of sea level rise: thermal expansion, melting land ice and vertical land movement.
- Finding and processing a valid range of sources, and judging how reliable each one is.
- Stakeholders, their evidence and their values, including mana whenua and kaitiakitanga.
- Personal and societal responses, and how to justify one and evaluate the other.
What AS 91411 asks of you
- AS 91411 is a 4-credit internal. You research a current issue where Earth or space science meets people's lives, then report on it.
- Achieved: gather and process a range of good-quality scientific information, explain the issue and how it affects individuals and society, and describe a personal response (your view) and a societal response (what a community, iwi, council or government is doing or could do).
- Merit: explain all of that in detail, with the reasons behind each response.
- Excellence: evaluate the issue and its impacts (weighing them, not listing them), justify your own response with evidence, and evaluate the societal response, including its strengths, weaknesses and who wins or loses.
Choosing a New Zealand issue
- A good issue has real Earth or space science at its heart, a decision still to be made, and people who disagree for reasons you can find and quote.
- Narrow it to one place and one decision: not climate change, but whether a council should plan managed retreat for a particular coastal suburb.
| Issue | The science | A decision to research |
|---|---|---|
| Sea level rise | Ocean warming, melting ice, land sinking or rising | Protect, adapt or retreat in South Dunedin or Hawke's Bay |
| Freshwater allocation | Aquifers, recharge, river flows, nitrate leaching | How much water Canterbury irrigators may take |
| Seabed mining | Sediment plumes, seabed ecology, ironsand geology | Ironsand mining in the South Taranaki Bight |
The science behind sea level rise
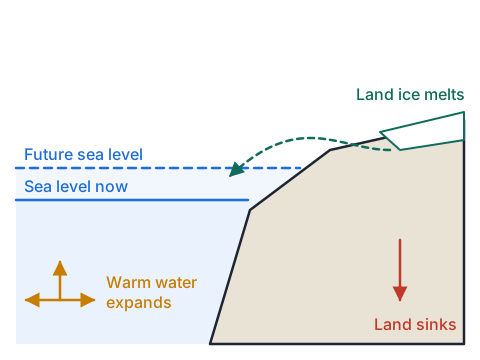
- Seawater expands as it warms, and the ocean has absorbed most of the extra heat trapped by greenhouse gases, so thermal expansion is the largest single cause of the rise so far.
- Mountain glaciers and the Greenland and Antarctic ice sheets are losing ice, and that meltwater adds mass to the ocean; floating sea ice does not raise sea level when it melts, because it already displaces its own weight.
- Locally the land moves too: GPS and satellite radar show some New Zealand coasts sinking a few millimetres a year (for example around parts of Wellington) while others rise, so the rise people experience differs from the global average.
- The rate is speeding up, which is why planning uses projections to 2100 and beyond rather than the past trend.
| Measure | Value |
|---|---|
| Global mean rise, 1901 to 2018 | 0.20 m |
| Rate, 1901 to 1971 | 1.3 mm per year |
| Rate, 2006 to 2018 | 3.7 mm per year |
| Share of the 1971 to 2018 rise from thermal expansion | 50% |
| Projected rise by 2100, medium emissions (SSP2-4.5) | 0.44 to 0.76 m |
Example: from a global projection to a local one
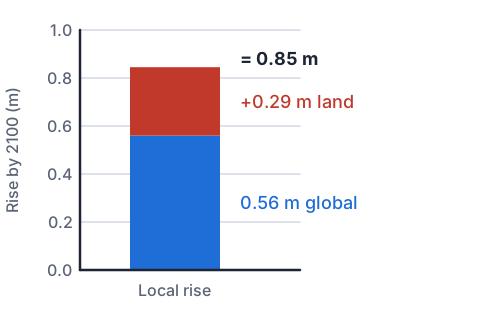
- A council uses the middle of the SSP2-4.5 projection, 0.56 m of global rise by 2100, measured from a 1995 to 2014 baseline (centred on 2005).
- Suppose NZ SeaRise data show a suburb's land sinking at 3.0 mm a year. Find the local rise by 2100.
- years from 2005 to 2100 = 95
- land sinking = 3.0 mm a year × 95 years = 285 mm = 0.285 msinking land makes the sea rise further against it
- local rise = 0.56 m + 0.285 m = 0.845 m
- 0.845 ÷ 0.56 = 1.5, so half as much again as the global figure
- about 0.85 m of local rise by 2100
Try it: global rise and land movement
A valid range of sources
- Use several kinds of source: scientific reports, official data, council documents, news and the stated views of the people affected.
- For each source ask who wrote it and what their expertise is, whether it is recent, whether it gives evidence or only opinion, whether it was checked by others, and whether the author gains from one answer.
- Processing means more than copying: pull out the key figures, compare what different sources say, and note where they agree and where and why they differ.
- Reference every source so a reader can check it, and keep your evaluation of each one in your notes; that becomes Excellence evidence.
| Source | Type | How far to trust it |
|---|---|---|
| IPCC report | Peer-reviewed assessment | High; global, so add local data |
| NZ SeaRise land movement data | Official research data | High for local rates |
| Council adaptation strategy | Plan and consultation record | Good for options and costs |
| Opinion piece or social post | Personal view | Shows values; check any facts |
Try it: evidence or values?
Stakeholders, their evidence and their values
- A stakeholder is anyone affected by, or with power over, the decision: residents, councils, insurers, banks, farmers, infrastructure providers, central government, and iwi and hapū who are mana whenua.
- Separate what each group knows (their evidence) from what they care about (their values); people can agree on the science and still disagree on what to do.
- Homeowners may value their homes and community and fear losing their savings; insurers look at the rising cost of claims; a council weighs rates, roads and pipes against the cost of each option.
- For many hapū, coastal marae, urupā and mahinga kai cannot simply be moved; kaitiakitanga asks for decisions that look after the whenua and moana for future generations.
Responses: protect, accommodate, retreat
- Protect: sea walls, stopbanks and beach nourishment hold the line, but they are costly, need upkeep, and can move erosion along the coast.
- Accommodate: raise floor levels, build houses that can be moved, improve drainage and pumping, so people stay while the hazard grows.
- Managed retreat: plan to move homes and services away over decades, with rules on who pays.
- Because the amount of rise by 2100 is uncertain, the Ministry for the Environment's coastal guidance uses adaptive pathways: agree trigger points (such as how often a road floods) at which the community switches to the next option; Hawke's Bay's Clifton to Tangoio strategy plans this way.
Example: one response at each grade
- A student researching South Dunedin wrote these about the council's response.
| Grade | What the student wrote |
|---|---|
| Achieved | South Dunedin is low-lying and the groundwater is close to the surface. As the sea rises the groundwater will rise too, causing flooding. The council is planning ways to adapt. I think people should be helped to move. |
| Merit | Because the groundwater is linked to the harbour, every centimetre of sea level rise lifts the water table, so surface flooding after rain will become more frequent. The council's plan considers pumping, raising land and moving people over time, because no single option works for the whole area. I support planned retreat because pumping only buys time while the rise continues. |
| Excellence | Pumping and drainage protect homes in the short term at lower cost, but the rise is projected to continue past 2100, so they only delay the problem and the bill grows each decade. Planned retreat is fairer to future ratepayers but costs current owners most, especially renters and older people with little choice. An adaptive pathway with clear triggers balances these: I justify it because it acts on today's evidence while allowing for the uncertain amount of rise, provided owners are compensated so the cost does not fall on the households least able to pay. |
Common mistakes
- Melting sea ice around Antarctica is a main cause of sea level rise.Floating ice already displaces its weight; the rise comes from warming water and from ice on land melting or sliding into the sea.
- My personal response: I think it is a big problem and someone should fix it.Give a specific action, who should take it, and the evidence and values that support it.
- Every source agreed, so I only needed three websites.Use a range of source types and say how reliable each is; disagreement between them is useful evidence to discuss.
- Local sea level will rise exactly as much as the global average.Local rise is the global rise plus the effect of the land sinking or rising, which differs along the coast.
Look up your nearest coast's future
You need: a phone or computer with internet, paper and a pen
- Open the NZ SeaRise maps at searise.nz and find the coastal point nearest your home or a place you know.
- Write down its vertical land movement in millimetres a year, and whether the land is sinking or rising.
- Note the projected local rise for 2100 under a medium emissions scenario, and compare it with the global figure of about 0.56 m.
- Find the same place on your council's coastal hazard map, if it has one, and list who would be affected: homes, roads, marae or farmland.
- Look for: places only a few kilometres apart can face quite different futures because the land under them is moving differently.
Safety: Do this online; if you visit the coast to look, keep off eroding cliff edges and stay well back from the waves on exposed beaches.
Your turn
A town's land is rising at 1.0 mm a year. Using 0.56 m of global rise from 2005 to 2100, find the local rise.
How many times faster was global sea level rising in 2006 to 2018 (3.7 mm a year) than in 1901 to 1971 (1.3 mm a year)?
A property developer's blog says sea level rise is exaggerated, with no data. How should you treat it in your report?
A council plans to move houses away from an eroding coast over 30 years. Which type of response is this?
Why can parts of Wellington face a faster local rise than the global average?
Show answer
1. Rising land reduces the local rise: 1.0 mm × 95 = 95 mm = 0.095 m, so 0.56 − 0.095 = 0.465 m, about 0.47 m. 2. 3.7 ÷ 1.3 = 2.8 times faster. 3. As evidence of a stakeholder's view, not as scientific evidence: the author has a financial interest and gives no data, so check any claim against IPCC or NZ SeaRise data. 4. Managed retreat. 5. The land there is sinking, so the local rise is the global rise plus the subsidence.
Recap
- Pick one New Zealand place and one decision, with real Earth or space science behind it.
- Sea level rises from warming water and melting land ice; local rise adds the land's own movement.
- Use and evaluate a range of sources; separate stakeholders' evidence from their values.
- Excellence weighs impacts, justifies your own response with evidence and evaluates the societal one, including who bears the cost.
| Response | What it means |
|---|---|
| Protect | Hold the line with walls, stopbanks or sand |
| Accommodate | Stay, but raise, drain and adapt |
| Managed retreat | Move away in a planned way over time |
| Adaptive pathway | Switch options at agreed trigger points |
Report a mistake
How is NCEA Level 3 maths going?
See the NCEA Level 3 maths guide