Zonation on a rocky shore: investigating a community pattern
What this lesson covers
- Community patterns such as zonation, stratification and succession, and the difference between distribution and abundance.
- Sampling a shore with randomly placed transects and quadrats, counting animals and estimating percentage cover.
- Processing field data: means across transects, density per square metre, tables and kite diagrams.
- How abiotic factors, mainly time out of the water, set the upper limit of most shore species.
- How competition and predation set the lower limit, and the difference between fundamental and realised niches.
- Structural, behavioural and physiological adaptations, and how to link them to the pattern for Merit and Excellence.
What counts as a pattern in a community
- A community is all the populations of different species living together in one place, such as everything on a rocky shore.
- Distribution is where a species is found; abundance is how many there are, given as a count, a density (number per m²) or a percentage cover.
- Zonation is species arranged in bands along an environmental gradient, like the bands down a rocky shore from the splash zone to the low tide mark.
- Stratification is layering by height, such as the canopy, understorey and forest floor of a bush remnant; succession is change in a community over time, such as a slip slowly turning back into bush.
- For this standard you describe your findings, use them to identify the pattern (or show there is none), link it to an environmental factor, and explain how that factor affects the species you chose.
The zones of a rocky shore
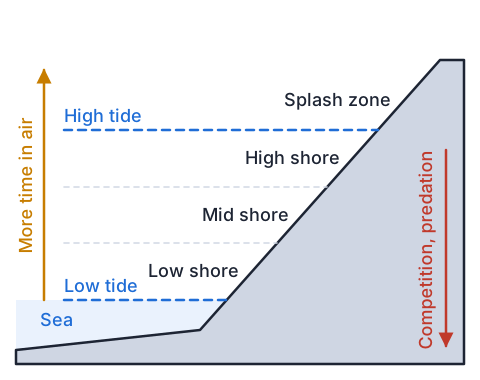
- Tides cover and uncover the shore, on average twice a day, so a rock high on the shore spends most of its time in air while a rock near the low tide mark is rarely out of the water.
- The longer a spot is out of the water, the hotter, drier, saltier and more changeable it gets, because sun and wind dry the rock and rain can dilute pools.
- Down the shore the conditions get gentler, more species can survive, and so there are more competitors for space and more marine predators such as whelks and sea stars.
- That steep gradient over only a few vertical metres is why shore life forms such clear bands.
| Zone | Time out of water | Typical life |
|---|---|---|
| Splash zone | Above the spring high tide; wet only by spray | Lichens, with periwinkles at its lower edge |
| High shore | Covered only near the top of the tide | Blue-banded periwinkles, barnacles |
| Mid shore | Roughly equal time in air and water | Barnacles, oysters, tubeworms |
| Low shore | Exposed for only a few hours at low tide | Seaweeds, coralline turf, more predators |
Upper limits and lower limits
- For most shore species, the top of their band is set by an abiotic factor they cannot tolerate any longer, usually heat and drying out (desiccation) during long spells in the air.
- The bottom of their band is usually set by biotic factors: competition from other species for space on the rock, and predators that can only feed while the tide is in.
- The fundamental niche is the range a species could live in on its own; the realised niche is the narrower range it actually occupies once competitors and predators are present.
- Experiments show this: when scientists cage predators out of the low shore, or scrape away a competitor, barnacles settle and survive further down than before.
Sampling the shore: transects and quadrats
- Run each transect (a measuring tape) from the top of the splash zone straight down the shore to the water's edge, starting at a random point along the shore so you do not pick the interesting bits.
- Place quadrats at equal fractions of each transect's length (every tenth, for example), so quadrat 3 on every transect is at roughly the same tidal height even if the transects are different lengths.
- Count mobile animals such as snails and whelks; estimate percentage cover for seaweeds and for crowded sessile animals such as barnacles; count an organism on the frame only if more than half of it is inside.
- Record abiotic factors at each quadrat as well, such as rock temperature, slope, substrate and whether the spot is in a pool or on open rock.
- Use three or more transects and pool them, because one transect can land on an odd patch; start at the water's edge as the tide turns and work up the shore ahead of it.
- Put every rock back the way it was, take nothing, and check with your teacher for any rāhui on the shore, out of respect for Tangaroa and the hapū who are kaitiaki there.
Example: one class's survey
- A Year 12 class ran three transects down a sheltered rocky shore at low tide and placed a 0.25 m² quadrat at six evenly spaced points on each, Q1 at the top of the high shore and Q6 at the water's edge.
- The table gives the mean of the three transects at each quadrat, plus the rock temperature they measured at each point on a sunny afternoon.
- Describe the pattern for each species, quoting numbers.
| Quadrat | Periwinkles (count) | Barnacles (% cover) | Neptune's necklace (% cover) | Lined whelks (count) | Rock temp. (°C) |
|---|---|---|---|---|---|
| Q1 (high) | 42 | 2 | 0 | 0 | 29 |
| Q2 | 28 | 45 | 0 | 0 | 27 |
| Q3 | 9 | 60 | 5 | 0 | 24 |
| Q4 | 1 | 25 | 40 | 2 | 21 |
| Q5 | 0 | 5 | 70 | 4 | 18 |
| Q6 (low) | 0 | 0 | 55 | 3 | 16 |
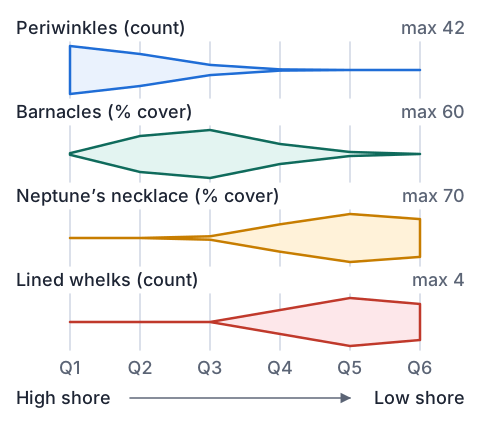
- periwinkles: most at Q1 (42), falling to 0 by Q5a band at the top of the shore
- barnacles: peak at Q3 (60%), few above Q2 or below Q4a band in the high to mid shore
- Neptune's necklace: first at Q3, peak at Q5 (70%)a band in the mid to low shore
- lined whelks: only from Q4 down, most at Q5 (4)the predator stays low
- rock temperature falls from 29 °C at Q1 to 16 °C at Q6the abiotic gradient
- the species form bands that replace each other down the shore: zonation
Example: from counts to density
- At Q1 the three transects counted 38, 47 and 41 periwinkles in their 0.25 m² quadrats.
- Find the mean count and the density per square metre.
- mean = (38 + 47 + 41) ÷ 3 = 126 ÷ 3 = 42 per quadratadd the transects, divide by how many
- quadrats per m² = 1 ÷ 0.25 = 4a 0.5 m by 0.5 m frame is 0.25 m²
- density = 42 × 4 = 168 periwinkles per m²
- percentage cover is already per unit area, so 60% barnacle cover is not multiplied
Adaptations that fit each band
- Structural adaptations are body features, behavioural ones are what the organism does, and physiological ones are how its body chemistry works.
- Blue-banded periwinkles (Austrolittorina antipodum) cluster in crevices at low tide (behavioural), seal the shell opening with an operculum and a mucus pad, have pale bands that reflect sunlight (structural), and can survive losing much of their body water (physiological), so they cope with the top of the shore.
- Barnacles are cemented inside hard, pale shell plates that close at low tide to trap seawater (structural and behavioural), but they filter-feed with feathery legs only when covered, so very high on the shore they starve and dry out.
- Neptune's necklace (Hormosira banksii) stores water in round, bead-like sacs with a low surface area to volume ratio, so it can photosynthesise through a low tide, but it still needs regular wetting and does best lower down.
Competition and predation lower down
- Barnacles and seaweeds both need bare rock to settle on; seaweed grows over the rock and slows the water flow that barnacles feed from, so where Neptune's necklace thrives, barnacle cover falls (interspecific competition).
- Lined whelks (Buccinulum linea) prey on barnacles, but only hunt while the tide is in, so the lower the barnacle, the longer it is exposed to whelks (predation).
- High on the shore whelks have too little time under water to feed, so the upper shore is a refuge for barnacles from marine predators.
- Grazers such as limpets and topshells eat the film of algae on the rock, and mutualism (both species gain) is possible too, but you only need the interrelationships your data and research support.
Example: explaining the barnacle band at each grade
- Achieved describes the pattern with data and links it to an environmental factor and how that factor affects the species.
- Merit gives a reason, through one species' adaptation and an interrelationship with another species, for why it lives where it does.
- Excellence uses the environmental factor and the biology of several interacting species together to explain both edges of the band, with the class's data as evidence.
| Grade | What the student wrote |
|---|---|
| Achieved | Barnacles form a band in the high to mid shore, peaking at 60% cover at Q3 and absent at Q6. Higher quadrats are out of the water longer and get hotter (29 °C at Q1), so barnacles there dry out and have little time to feed. |
| Merit | Barnacles close their shell plates at low tide, trapping seawater so they do not dry out, which lets them live higher than most species. Below Q4 their cover falls as lined whelks appear (up to 4 per quadrat), because whelks feed on barnacles while the tide is in. |
| Excellence | The barnacles' upper limit is set by desiccation: their feeding legs work only under water, so at Q1 they cannot feed long enough and only 2% cover survives. Their lower limit is set by other species: from Q4 Neptune's necklace (40 to 70%) takes the rock space they need to settle, and whelks, which cannot feed in air, hunt longest at the low quadrats. So the band at Q2 to Q3 is the narrow part of their fundamental niche where it is wet enough to feed but too exposed for their competitor and predator. |
Evaluating your evidence
- No pattern is a valid finding too, if your data show it; say so and explain what might cause it, such as a shore so wave-washed that every level stays wet.
- Say how far your evidence goes: one shore, one day and one season can miss changes, and percentage cover estimates vary from person to person.
- Compare your data with other groups, earlier classes or published surveys such as the Marine Metre Squared records, and say whether they agree.
- Cause is an inference: your data show where species are, while research and experiments (like cage exclusions) support why.
Common mistakes
- The barnacles live in the mid shore because they like it there.Name the factor and the mechanism: at the top they dry out and cannot feed; lower down they lose space to seaweed and are eaten by whelks.
- Periwinkles have adapted to the high shore so they can survive there.Adaptations evolved over generations by natural selection; an individual snail does not adapt on purpose, it already has the features.
- There were 42 periwinkles at Q1, so the density is 42 per m².That count is per 0.25 m² quadrat, so the density is 42 × 4 = 168 per m².
- I chose where to put my transect so it went through the best rock pools.Choose the starting point at random so the sample represents the shore and is not biased by what looks interesting.
Run a transect across a garden edge
You need: a ball of string, 4 tent pegs or sticks, a 30 cm ruler, a tape measure, paper and a pen, a phone with a light meter app, if you have one
- Find a lawn that runs from deep shade (under a tree or beside a fence) out into full sun, and peg a string transect from the shade to the sun.
- Make a quadrat by laying out string around a 30 cm by 30 cm square with the pegs, and place it at 5 equal spacings along the transect.
- In each quadrat estimate the percentage cover of grass, moss and bare soil, and count any daisies or clover plants.
- Measure the light at each quadrat with the phone app, or score it from 1 (deep shade) to 5 (full sun).
- Draw a kite diagram of your results. Look for: moss highest in the shade and grass in the sun, with the light reading changing along the same line.
Safety: Bees feed on clover and daisy flowers, so look before you put your hand down and stop if you are allergic to stings.
Your turn
Three transects gave 3, 6 and 3 lined whelks in their Q5 quadrats. Find the mean per quadrat.
Turn that mean into a density per m², using 0.25 m² quadrats.
Using the class's table, describe where Neptune's necklace is found and where it is most abundant.
What kind of factor most likely sets the lower limit of the barnacle band?
Periwinkles crowd into crevices at low tide. Is that a structural, behavioural or physiological adaptation?
Show answer
1. (3 + 6 + 3) ÷ 3 = 12 ÷ 3 = 4 whelks per quadrat. 2. 4 × 4 = 16 whelks per m². 3. From Q3 down to Q6, most abundant at Q5 (70% cover): a band in the mid to low shore. 4. Biotic factors: competition for space with Neptune's necklace and predation by lined whelks. 5. Behavioural, because it is something the snail does; the crevice keeps it cooler and damper.
Your turn: write it up
Write an Achieved sentence describing the periwinkle pattern, quoting data.
Give one reason, using an adaptation, why periwinkles can live at Q1 where barnacles cannot.
Lined whelks were absent from Q1 to Q3. Explain why, for a Merit answer.
Show answer
1. Periwinkles are most abundant at the top of the shore (42 per quadrat at Q1) and decrease down the shore until none are found at Q5 and Q6. 2. Periwinkles can survive losing a lot of body water and seal themselves in with an operculum, and they graze the film of algae on damp rock, while barnacles can only filter-feed under water. 3. Whelks hunt only when covered by the tide and cannot tolerate long spells in air, so the high quadrats, out of the water for most of the tide, give them too little feeding time and dry them out.
Recap
- Zonation is bands of species along a gradient; on a rocky shore the gradient is time out of the water.
- Random transects with quadrats at equal fractions give data you can pool; animals are counted, seaweeds and barnacles get percentage cover.
- Upper limits are mostly abiotic (heat, drying out); lower limits are mostly biotic (competition, predation).
- Merit links one species' adaptation and an interrelationship to the pattern; Excellence uses the factor and several interacting species together, with data.
| Species | Band | Main reason for the band |
|---|---|---|
| Periwinkles | Splash zone and high shore | Tolerate heat and drying out |
| Barnacles | High to mid shore | Above: too dry to feed. Below: seaweed and whelks |
| Neptune's necklace | Mid to low shore | Needs regular wetting; wins rock space lower down |
| Lined whelks | Low shore | Feed only under water |
The maths behind it
How is NCEA Level 2 maths going?
See the NCEA Level 2 maths guide